In a public library, the librarian made the following observations in a particular week.
Days
Monday
Tuesday
Wednesday
Thursday
Friday
Saturday
Newspaper reader
Magazine reader
(i) Draw a double bar graph choosing an appropriate scale.
(ii) On which day, the number of readers in the library was maximum?
(iii) What is the mean number of magazine readers per day.

Important Questions on Bar Graphs

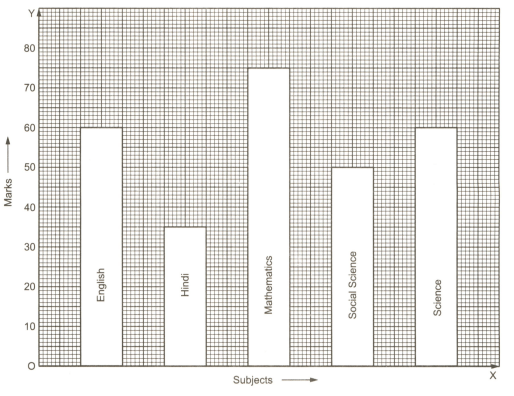
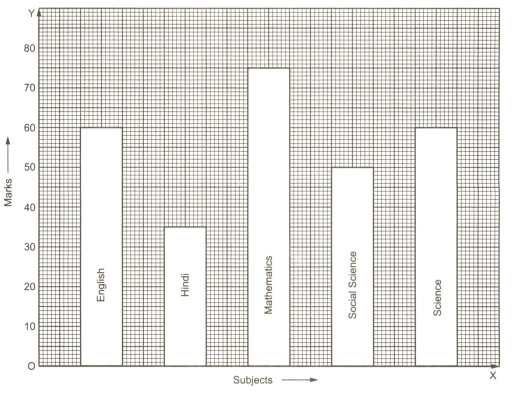
In which subject is the student very good?

In which subject is the poor?
On a particular day in a school, the attendance in each of the classes from VI to X has been recorded as under.
Which class has the maximum number of students?
| Class | Class VI | Class VII | Class VIII | Class IX | Class X |
| Total no. of students | |||||
| Number of students present on that day |
Consider the data, showing the average daily hours of sunshine in two cities Aberdeen and Margate for six months of an year.
In which month has Aberdeen has maximum sunlight?
| Month | January | February | March | April | May | June |
| Number of hours of sunshine in Aberdeen | ||||||
| Number of hours of sunshine in Margate |
The table given below shows the population of four towns over two years.
| Towns | A | B | C | D |
(i) Draw a bar graph using appropriate scale to depict the information given here.
(ii) In which town was the population growth maximum.
(iii) In which town was the population growth least.
The table given below shows the population of four towns over two years.
| Towns | ||||
If the population growth was maximum in town , then write the answer as .
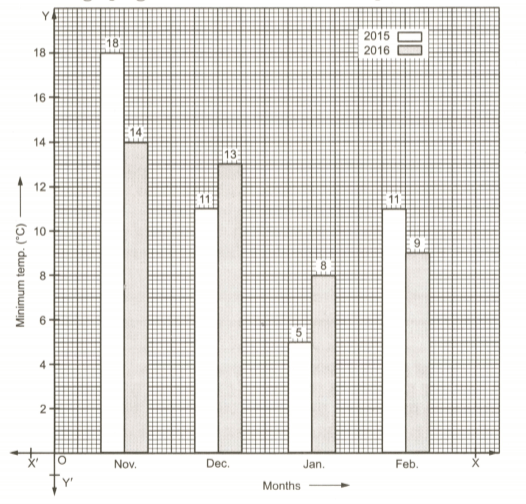
Study the double bar graph given below and answer the questions that follow.

What has been compared in the given double bar graph?
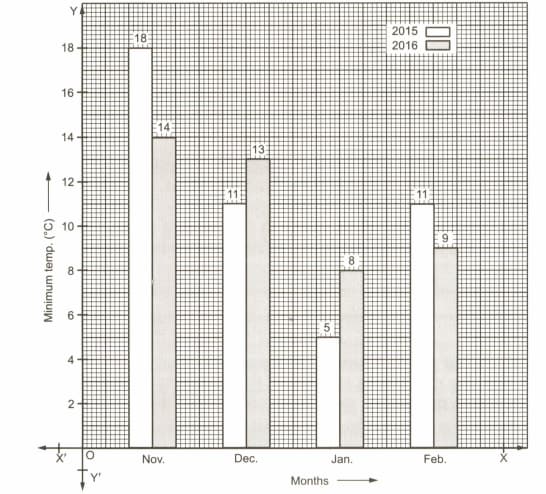
Study the double bar graph given below and answer the questions that follow.

What is the ratio of minimum temperatures in the year to the year in the month of November?
