
MEDIUM
Earn 100
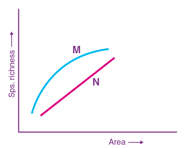
In the plot of the species-area relationship for the co-efficient z, the axis X and Y, represents
50% studentsanswered this correctly
Important Questions on Biodiversity and Conservation
EASY
MEDIUM
EASY
EASY
EASY
EASY
EASY
Match for and with the species-area relationship shown in the graphic representation below and choose the correct option.
EASY
EASY
MEDIUM
A. The duration of time available for species diversification is limited.
B. Solar energy and water resources are available in abundance.
C. Tropical climates are not constant and cannot be predictable.
D. Tropical latitudes have remained relatively undisturbed for millions of years.
MEDIUM
EASY
EASY
EASY
EASY
EASY
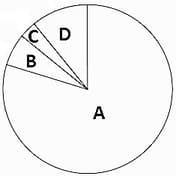
Given below is the representation of the extent of the global diversity of invertebrates. What groups the four portions (A-D) represent respectively?
EASY
EASY


