
EASY
10th CBSE
IMPORTANT
Earn 100
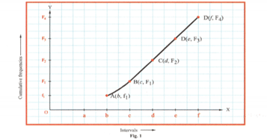
Join the plotted points by a freehand curve using a sketch pen, as shown in the figure.
Important Questions on Statistics
MEDIUM
10th CBSE
IMPORTANT
Form a cumulative frequency table of more than type for the data given below:
| Height | More than or equal to | More than or equal to | More than or equal to | More than or equal to | More than equal to |
| Cumulative Frequency |
MEDIUM
10th CBSE
IMPORTANT
Take two perpendicular lines and on the squared paper and graduate them with divisions as needed by the data.
Represent the below data on the squared paper.
| Height | More than or equal to | More than or equal to | More than or equal to | More than or equal to | More than equal to |
| Cumulative Frequency |
MEDIUM
10th CBSE
IMPORTANT
On the squared paper, plot the points and .
Represent the given data on the graph.
| Height | More than or equal to | More than or equal to | More than or equal to | More than or equal to | More than equal to |
| Cumulative Frequency |
EASY
10th CBSE
IMPORTANT
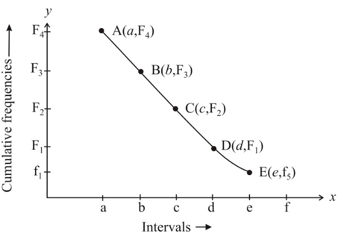
Join the plotted points by a freehand curve using a sketch pen, as shown in the figure.
EASY
10th CBSE
IMPORTANT
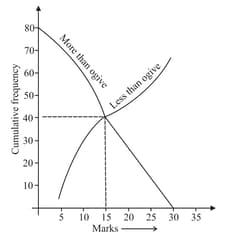
In the figure below, the value of the median of the data using the graph of less than ogive and more than ogive is:
EASY
10th CBSE
IMPORTANT
The lower limit of the modal class of the following data is
| Class Limit (CL) | Frequency |
|---|---|
EASY
10th CBSE
IMPORTANT
If mode of the following data is , then value of in is :
EASY
10th CBSE
IMPORTANT
Which of the following is not measure of central tendency


