
Mark the correct graph that represents the type of selection that this population is likely to undergo.
Important Questions on Evolution
Study the characteristic of a population represented in the graph below:
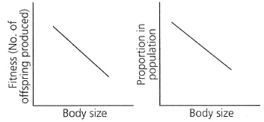
Which type of selection, this population is likely to undergo?
Following table shows data on amino acid substitution in the chain of haemoglobin in four different mammalian species A, B, C and D. On the basis of the data shown in the table, choose the most appropriate evolutionary tree from those given below.
|
Comparison of Species |
Number of Amino Acid Substitution |
| A and B | 19 |
| B and C | 26 |
| A and C | 27 |
| D and C | 27 |
| A and D | 20 |
| D and B | 1 |
In a long term experiment on a population of Drosophila melanogaster, the frequency of two alleles 'a' and 'b' of a multi-allelic locus X over time has been shown in the following graph.
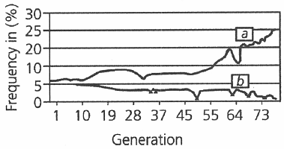
6 students were asked to evaluate the observed pattern and their inferences are given below.
Student 1: Environment is not uniformly selective.
Student 2: Population may be under artificial selection.
Student 3: Genetic variability is progressively reduced.
Student 4: Genetic variability is progressively increased.
Student 5: Mechanism such as genetic drift is operating from time to time.
Student 6: Selection is favouring a particular genotype through directional selection.
The appropriate conclusions were drawn by
**Formatting error resolved. Scientific name was changed in Italics.**


