
Population of a country (in millions) was as follows:

Draw a bar graph.
Important Questions on Data Handling
The marks obtained by students are shown in the following table:
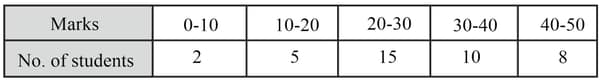
Draw a histogram for above data.
Observe the histogram given below and answer the following questions:
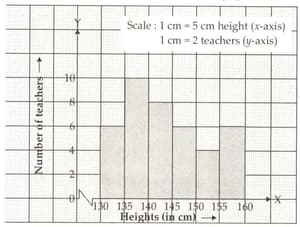
What information is being given by the histogram?
Observe the histogram given below and answer the following questions:

How many teachers are of or above height?
Observe the histogram given below and answer the following questions:

How many teachers have the heights below?
Observe the histogram given below and answer the following questions:

Which interval has maximum teachers?
Observe the histogram given below and answer the following questions:
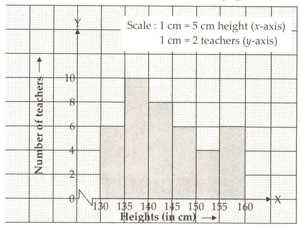
What is the total number of teachers?
The monthly school fees of all the schools in a city recorded as follows:
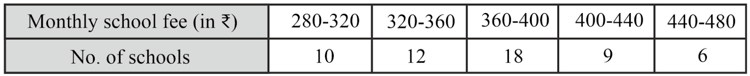
Construct a histogram for the above data.
The ages of teachers in a school are as follows:


