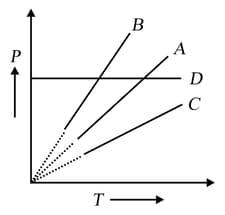
Pressure-temperature graph of the ideal gas at constant volume is shown by a straight line Now, pressure of the gas is doubled and the volume is halved; then the corresponding pressure temperature graph will be shown by the line
Important Questions on Kinetic Theory of Gases
Two balloons are filled; one with pure gas and the other with air, respectively. If the pressure and temperature of these balloons are the same, then the number of molecules per unit volume is
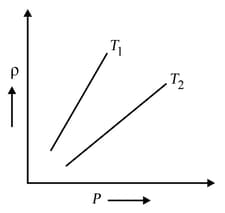
The density versus pressure graphs of a given mass of an ideal gas is shown at two temperatures and Then relation between and may be
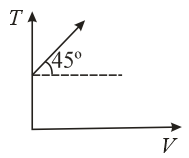
The given curve represents the variations of temperature as a function of volume for one mole of an ideal gas. Which of the following curves best represent the variation of pressure as a function of volume?