
Representation of data by using pictures is known as
.
Important Questions on Statistics
Draw a pictograph for the given data.
| Month | June | July | August | September |
| Number of computers sold |
(Choose your own suitable scales)
The following table shows the number of tourists who visited the places in the month of May. Draw a pictograph.
| Place | Mahabalipuram | Vedanthangal | Hogenakkal | Ooty |
| Number of Tourists | 20,000 | 15,000 | 40,000 | 35,000 |
(Choose your own suitable scale)
The following pictograph shows the number of students playing different games in a school.
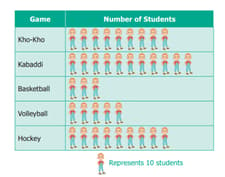
Answer the following question.
Which is the most popular game among the students?
The following pictograph shows the number of students who play different games in a school.

Find the number of students who play kabaddi.
The following pictograph shows the number of students who play different games in a school.
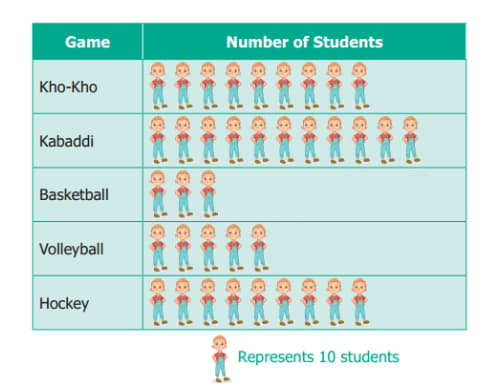
Which two games are played by an equal number of students?
The following pictograph shows the number of students who play different games in a school.

What is the difference between the number of students who play Kho-Kho and Hockey?
The following pictograph shows the number of students who play different games in a school.

Which is the least popular game among the students?


