
Study the following data carefully and answer the questions:
There are 5 trains A, B, C, D and E and all the trains are of different lengths.
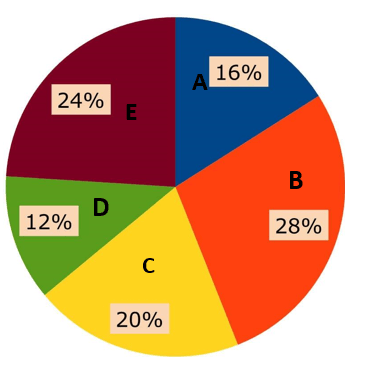
Pie chart given below shows the percentage distribution of the speeds (in) of five given trains and sum of the pie chart is .
Line graph given below shows the extra time (in seconds) taken by each train to cross a platform of length equal to that train, when running with of their original speeds.
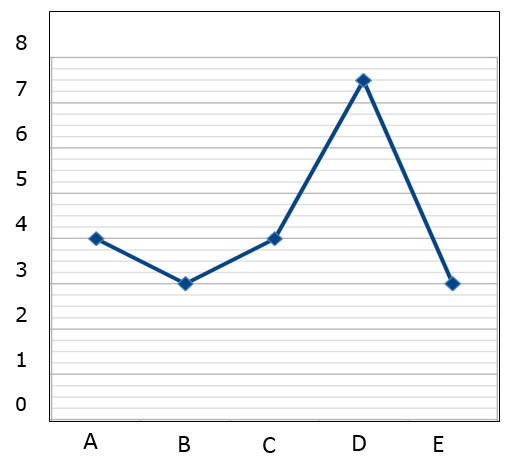
Note: Length of train will be negligible when it goes from one station to another station.
A man goes from station M to station N. He covers of total journey by train A and rest by train C. If total time taken by man during the whole journey is , then find the distance between station M and station N (in ).
Important Questions on Graphical Representation of Data
A number is multiplied by instead of . New value is what per cent of desired value?
In , the total population of a village was , out of which were females. In , the total population increased by as compared to the previous year. If the number of females remained the same in , what was the percentage increase in the number of males in as compared to ?
There are 10 boys and 10 girls in a group. After adding some boys to the group, the percentage of girls becomes 10%. How many boys were added.
The following table shows the number of students enrolled in different faculties in a college.
|
Science |
Arts |
Commerce |
Vocational |
||||
|
Girls |
Boys |
Girls |
Boys |
Girls |
Boys |
Girls |
Boys |
|
32 |
18 |
28 |
45 |
42 |
42 |
13 |
30 |
The percentage of students studying in faculties other than science is:
The number of students enrolled in different faculties in a school is as follows:
| Science | Arts | Commerce | Vocational | ||||
| Boys | Girls | Boys | Girls | Boys | Girls | Boys | Girls |
The percentage of students studying in Science & Vocational subjects is:


