
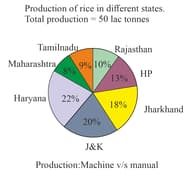
Study the following pie charts & bar charts and answer the following questions:

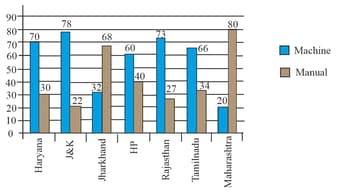
What is the ratio of production by manual method in TN to that of machine method in J&K?
Important Questions on Data Interpretation


What is the average production of rice by machine method for all states?

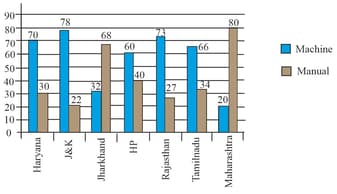
The production by machine method in Haryana is approximately what percent greater than the production by manual method in Maharashtra?
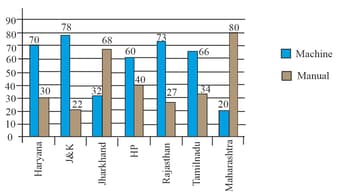
The production of rice in HP by manual method is approximately how many times the production in Jharkhand by machine method?

The above figure gives the country-wise and age-wise distribution of people who visited China for business set up.
If in a given year visited China, then the number of American nationals with age group above years who visited China are:
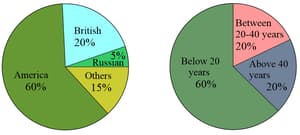
The given figures depict the country-wise and age-wise distribution of people who visit China for business set-up.
If in a given year, people visited China, then the number of American nationals of the age group below years who visited China is:
The given figures depict the country-wise and age-wise distribution of the people who visited China for business setup.
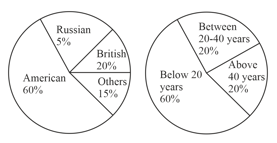
If in a given year,people visited China, then the number of British nationals in the age group between and years who visited China is:
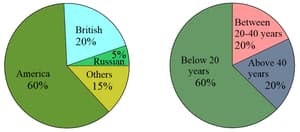
The given figure depicts the country-wise and age-wise distribution of the people who visit China for business setup. If in a given year people visited China, then the ratio of the number of Americans with the age group between and years to the Russians with the age group below years who visited China is:
Directions - The following pie chart shows the expenditure (in percentage) of five companies P, Q. R. S and T in the year 2016.
Total Expenditure crores
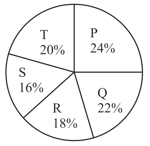
What was the total expenditure (in crores) of the company Q, R and T together?


