
The area of histogram of a data and its frequency polygon is the same. Reason how.
Important Questions on Statistics
| Class | |||||
| Frequency |
The cumulative frequency of the class of the above frequency distribution is _____.
The given graph shows the marks obtained by the students in an examination.
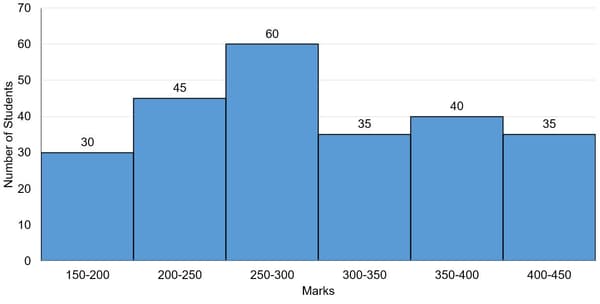
The numbers of students who obtained less than marks is what percent more than the number of students who obtained or more marks?
Find the value of in following table.
| Term | Frequency | Cumulative Frequency |
The table below shows, children of a class sorted according to their marks in an examination.
| Marks | Number of children |
If we arrange the children from the one with the least mark to the one with the greatest, then what will be the assumed mark of the student?
Study the given histogram that shows the marks obtained by students in an examination and answer the question that follows.
If the total marks obtained by students be represented as a pie chart, then the central angle of the sector representing marks or more but less than , is _____. (Correct to the nearest degree)
The given table represents the exports (in ₹ crores) of four items A, B, C and D over a period of six years. Study the table and answer the question that follows.
|
Items Year |
A | B | C | D |
In which year, the exports of item were the average exports of item during six years;
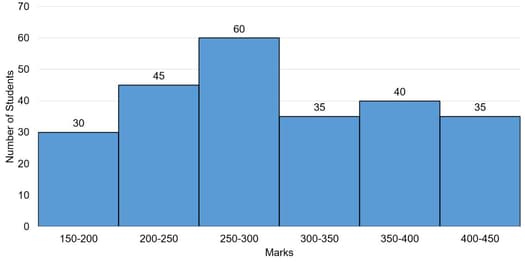
Study the given histogram that shows the marks obtained by students in an examination and answer the question that follows.

The number of students who obtained less than marks is what per cent more than the number of students who obtained or more marks? (Correct to one decimal place)
The given graph shows the weights of students in a school on a particular day.
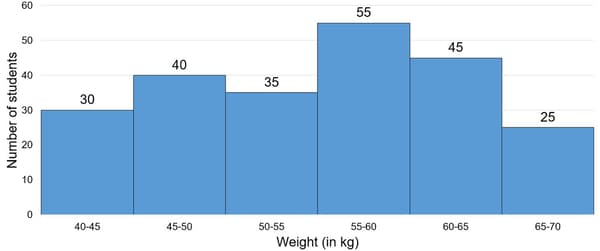
The number of students weighing less than is what percent less than the number of students weighing or more?
Study the given histogram that shows the marks obtained by students in an examination and answer the question that follows.

If the total marks obtained by students be represented as a pie chart, then the central angle corresponding to marks or more but less than , is _____. (Correct to the nearest degree)
Study the graph and answer the question,
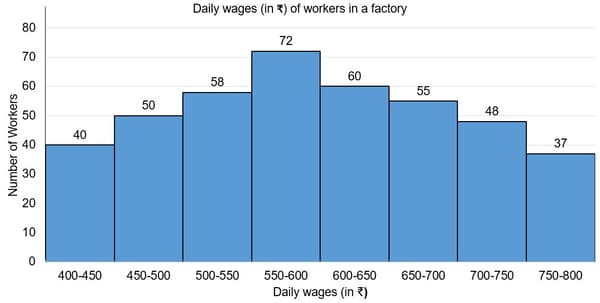
The number of workers in the factory whose daily wages are or more but less than is:
The given table represents the exports ( incrores) of four items and over a period of six years. Study the table and answer the question that follows:
| Items | ||||
| Years | ||||
The total exports of item from to is what percentage less than the total exports of all the four items in :(Correct to one decimal place)
The following table gives the frequency of vowels used in the page of a book.
| Vowels | a | e | i | o | u |
| Frequency |


