The average length of a sarcomere in a resting muscle is 2.25 . Calculate the magnification of your diagram and state the steps you took in making the calculation.
Important Questions on Control and Coordination
Name the structures A, B, and C in the given figure.
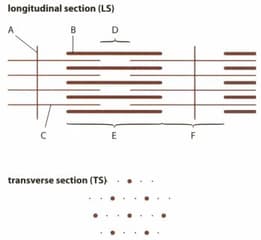
Name the regions of the sarcomere labelled D, E and F in the given figure.

State the region of the sarcomere where the TS was taken as shown in the given figure.

ADH, insulin and glucagon are hormones that control aspects of homeostasis. ADH is a short peptide, glucagon is a single polypeptide and insulin is composed of two polypeptides. The target cells for these hormones only respond if they have specific cell surface receptors.
Explain why the target cells for ADH, insulin and glucagon must have cell surface receptors in order for them to respond.
ADH, insulin and glucagon are hormones that control aspects of homeostasis. ADH is a short peptide, glucagon is a single polypeptide and insulin is composed of two polypeptides. The target cells for these hormones only respond if they have specific cell surface receptors.
State the target cells for each of these hormones.
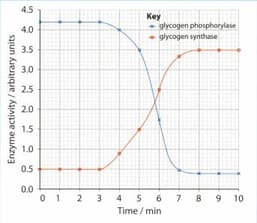
Two intracellular enzymes that are involved with the synthesis and breakdown of glycogen in liver cells are glycogen synthase and glycogen phosphorylase. Liver cells were exposed to a solution with a high concentration of glucose. The activity of the two enzymes was determined at intervals for 10 minutes. The graph shows the results.