
The data given below shows the average rainfall in Udaipur from June to November of a certain year. Draw a bar graph to represent this information.
Month
June
July
August
September
October
November
Average rainfall
Important Questions on Bar Graphs
The following table shows the market position of different brands of soaps. Draw a bar graph to represent this data.
| Brand | A | B | C | D | Others |
| Percentage of buyers |
Gold prices on Consecutive Tuesdays were as under. Draw a bar graph to show this information.
| Week | First | Second | Third | Fourth |
| Rate per |
Various modes of transport used by students of a school are given below. Draw a bar graph to show this information
| School bus | Private bus | Bicycle | Rickshaw | By foot |
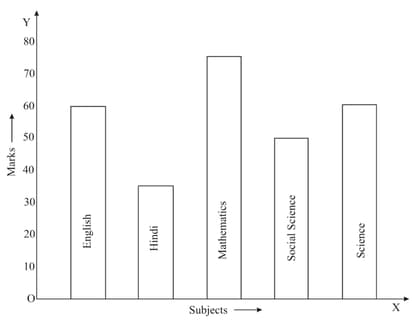
What information does the bar graph give?

In which subject is the student very good?
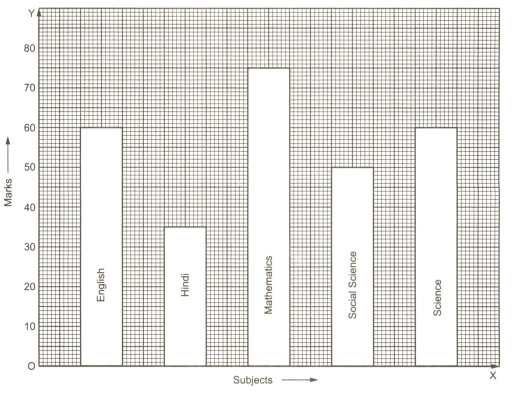
In which subject is the poor?

What is the average marks obtained by the student?
In a survey or families of a colony, the number of members in each family was recorded, and the data has been represented by the following bar graph.
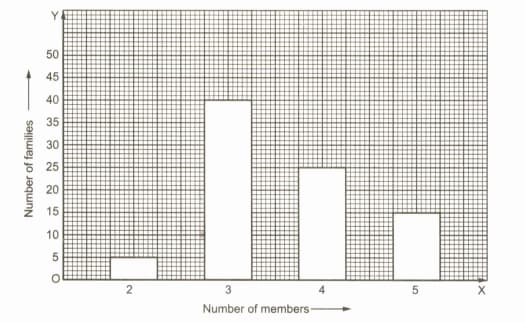
What information does the bar graph give?


