
The diagram shows a section through a leaf.
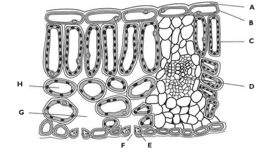
Most photosynthesis in plants happens in leaves name the two raw materials needed for photosynthesis.
Important Questions on Plant Nutrition
The diagram shows a section through a leaf.

Most photosynthesis in plants happens in leaves. Explain how photosynthesis produces glucose.

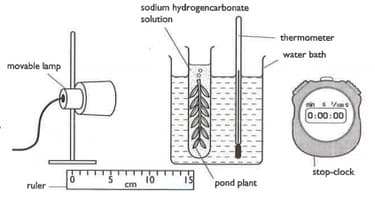
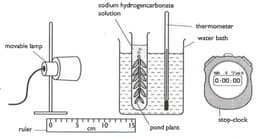
A student set up the apparatus shown in the diagram to investigate the effect of carbon dioxide concentration on the rate of photosynthesis of a pond plant. The student used five different similar pieces of pond plant and five different concentrations of sodium hydrogen carbonate solution, which provides the carbon dioxide. The student counted the number of bubbles produced by the pond plant over a period of five minutes.
Explain how the student made sure that the results were due only to the changes in carbon dioxide concentration. The student repeated the investigation at each concentration and calculated the rate of photosynthesis. The student’s results are shown in the table below.

A student set up the apparatus shown in the diagram to investigate the effect of carbon dioxide concentration on the rate of photosynthesis of a pond plant. The student used five different similar pieces of pond plant and five different concentrations of sodium hydrogen carbonate solution, which provides the carbon dioxide. The student counted the number of bubbles produced by the pond plant over a period of five minutes.
Calculate the mean rate of photosynthesis when the carbon dioxide concentration was 0.2%. The student repeated the investigation at each concentration and calculated rate of photosynthesis. The student’s results are shown in the table below.
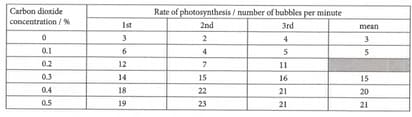

A student set up the apparatus shown in the diagram to investigate the effect of carbon dioxide concentration on the rate of photosynthesis of a pond plant. The student used five different similar pieces of pond plant and five different concentrations of sodium hydrogen carbonate solution, which provides the carbon dioxide. The student counted the number of bubbles produced by the pond plant over a period of five minutes. Plot the results from the table on graph paper.
Draw an appropriate line on the graph to show the relationship between carbon dioxide concentration and the rate of photosynthesis.The student repeated the investigation at each concentration and calculated the rate of photosynthesis. The student’s results are shown in the table below.


A student set up the apparatus shown in the diagram to investigate the effect of carbon dioxide concentration on the rate of photosynthesis of a pond plant. The student used five different similar pieces of pond plant and five different concentrations of sodium hydrogen carbonate solution, which provides the carbon dioxide. The student counted the number of bubbles produced by the pond plant over a period of five minutes.
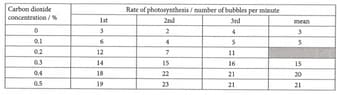
Explain the effect of increasing carbon dioxide concentration on the rate of photosynthesis up to 0.4% as shown in your graph. The student repeated the investigation at each concentration and calculated the rate of photosynthesis. The student’s results are shown in the table below.
A student set up the apparatus shown in the diagram to investigate the effect of carbon dioxide concentration on the rate of photosynthesis of a pond plant. The student used five different similar pieces of pond plant and five different concentrations of sodium hydrogen carbonate solution, which provides the carbon dioxide. The student counted the number of bubbles produced by the pond plant over a period of five minutes.
Suggest the result that the student would get if a carbon dioxide concentration of 0.6% was used and explain your answer. The student repeated the investigation at each concentration and calculated the rate of photosynthesis. The student’s results are shown in the table below.


A student set up the apparatus shown in the diagram to investigate the effect of carbon dioxide concentration on the rate of photosynthesis of a pond plant. The student used five different similar pieces of pond plant and five different concentrations of sodium hydrogen carbonate solution, which provides the carbon dioxide. The student counted the number of bubbles produced by the pond plant over a period of five minutes.
The student used tap water as the 0% carbon dioxide concentration. Explain why the student recorded some bubbles being produced. The student repeated the investigation at each concentration and calculated the rate of photosynthesis. The student’s results are shown in the table below.


