
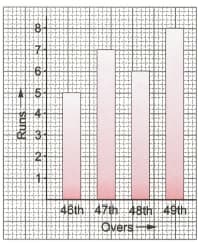
The following column graph shows the runs scored by India during a cricket match. The scale used is . At the beginning of the th over, India needed runs per over for the remaining over to win the match.
How many runs did India score in the th over?
Important Questions on Statistics
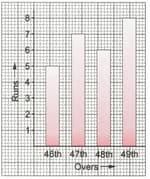
The following column graph shows the runs scored by India during a cricket match. The scale used is . At the beginning of the th over, India needed runs per over for the remaining over to win the match.
How many runs did India require to make in the th over to win in the match?
The following column graph shows the runs scored by India during a cricket match. The scale used is . At the beginning of the th over, India needed runs per over for the remaining over to win the match.
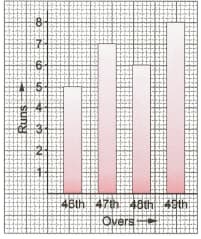
Represent the data in tabular form.
The table shows the time taken by four students to read a story. Represent the data by a bar graph.
| Name | Ruby | Nitin | Beeru | Bonny |
| Time taken (in min) |
The table shows the number of wickets taken by a bowler in five matches. Use a column graph to represent the data.
| Match | I | II | III | IV | V |
| Number of wickets |
Find the mean of the following set of data.
Find the mean of the following set of data. (Express answer in mixed fraction)
Find the mean of the following set of data.


