
The following graph shows a person's breathing rate before and after a period of vigorous exercise.
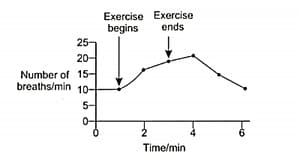
Study the graph and explain why there is a change in the graph. What changes occur during vigorous exercise? Explain.
Important Questions on Respiration in Plants and Animals
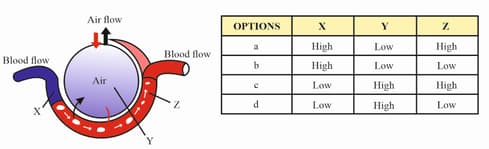
Study the given diagram showing the section through an alveolus and capillary.
Which of the following best describes the concentration of oxygen at X, Y and Z.
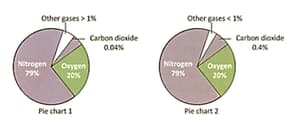
The following are the two pie charts which give the percentage of compositions found in exhaled air and inhaled air.
Explain the following terms
i. Inhaled air
ii. Exhaled air
The following are the two pie charts which give the percentage of compositions found in exhaled air and inhaled air.
Which pie chart is most likely taken from a sample of exhaled air?

The following are the two pie charts which give the percentage of compositions found in exhaled air and inhaled air.
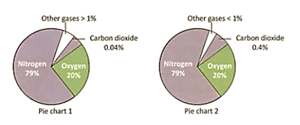
Which pie chart is most likely taken from the sample of exhaled air? Explain our answer?


