
MEDIUM
8th Foundation
IMPORTANT
Earn 100
The following graph shows the number of pages read by Ashok in a week.
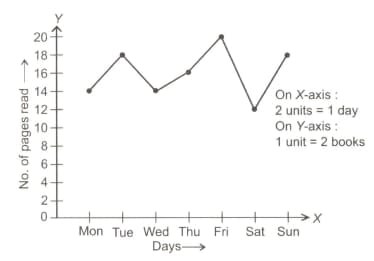
Find the ratio of number of pages read on Tuesday and Wednesday together to the total number of pages read.
50% studentsanswered this correctly
Important Questions on Introduction to Graphs
MEDIUM
8th Foundation
IMPORTANT
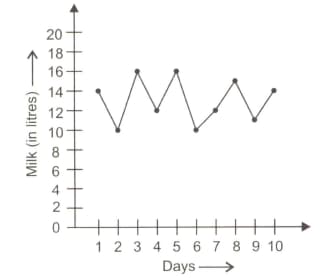
On an average, how much milk he sells every day?
MEDIUM
8th Foundation
IMPORTANT
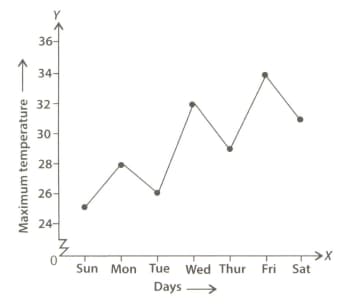
(a) On which day was the temperature ?
(b) On which day was the temperature the least?
(c) Which was the hottest day?


