
The given figure is an graph of the motion of a particle.

(i) At which of the points and , the velocity is positive?
(ii) At which points the velocity is negative?
(iii) At which points the velocity is zero?
(iv) At which of the points and is the acceleration positive?
(v) At which point is the negative?
(vi) At which points does the acceleration appear to be zero?
(vii) At each point, state whether the speed is increasing, decreasing, or not changing.
(iii) At which points the velocity is zero?
(vi) At which points does the acceleration appear to be zero?
(vii) At each point, state whether the speed is increasing, decreasing, or not changing.
Important Questions on Kinematics I
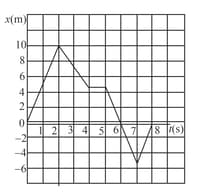
The position versus time graph for a certain particle moving along the -axis is shown in the figure. Find the average velocity in the time intervals
(a) to ,
(b) to , and
(c) to .
The position-time graphs for two children and returning from their school to their homes and , respectively, are shown in figure. Choose the correct entries in the brackets below.
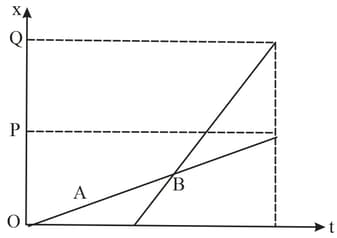
(a) lives closer to a school than
(b) starts from the school earlier than .
(c) walks faster than .
(d) and reach home at the (same/different) time.
(e) overtakes on the road (once/twice).
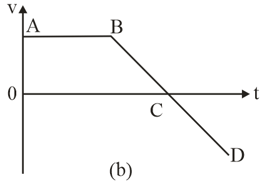
Describe the motion shown by the following velocity-time graphs.

The velocity versus time curve of a moving point is shown in the figure. Find the retardation of the particle for the portion .
As soon as a car just starts from rest in a certain direction, a scooter moving with a uniform speed overtakes the car at that time. Their velocity-time graph is shown in the figure. Calculate
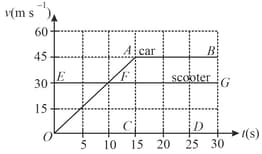
(a) The difference between the distances travelled by car and the scooter in .
(b) The distance of car and scooter from the starting point at that instant when the car catches scooter.
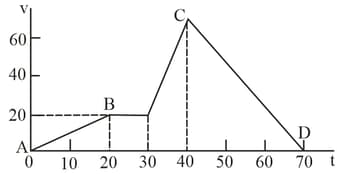
The velocity–time graph of a body moving along a straight line is given below. Find:
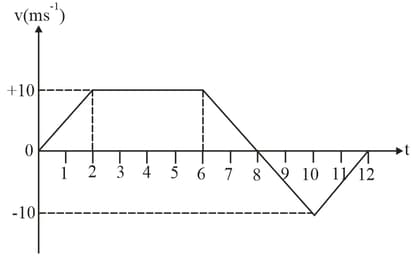
(a) Average velocity in whole time of motion
(b) Average speed in whole time of motion
(c) Draw acceleration vs time graph
A particle moves along -axis with an initial speed . If its acceleration varies with time as shown in graph in the figure,
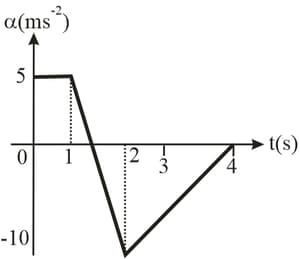
(a) Find| the velocity of the particle at .
(b) Find the time when the particle starts moving along -direction.
The given figure is a graph of the coordinate of a spider crawling along the -axis.
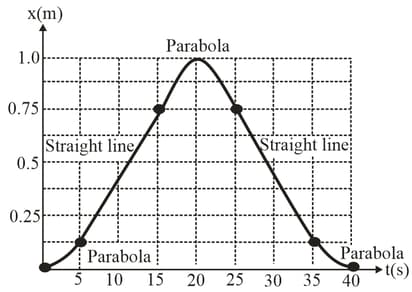
(a) Graph its velocity and acceleration as functions of time.
(b) In a motion diagram, show the position, velocity and acceleration of the spider at the five times: , and .


