The graph of pressure versus temperature for adiabatic process is best described by (use adiabatic constant
Important Questions on Thermodynamics
In the diagram below the dashed curved line is an adiabatic
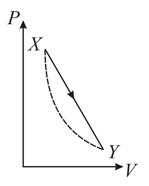
For a process that is described by a straight line joining two points and on the adiabatic (solid line in the diagram), heat is: (Hint: Consider the variations in temperature from and along the straight line)
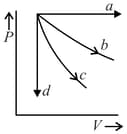
Thermodynamic processes are indicated in the following diagram.
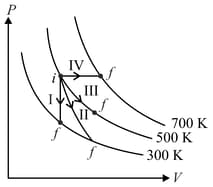
Match the following
| Column – 1 | Column - 2 |
| P. Process I | a. Adiabatic |
| Q. Process II | b. Isobaric |
| R. Process III | c. Isochoric |
| S. Process IV | d. Isothermal |
| Column – 1 | Column – 2 | Column – 3 |
| (I) | (i) Isothermal | (P) 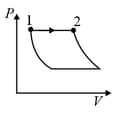 |
| (II) | (ii) Isochoric | (Q) 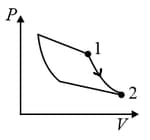 |
| (III) | (iii) Isobaric | (R) 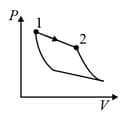 |
| (IV) | (iv) Adiabatic | (S)  |
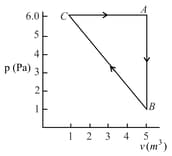
One mole of an ideal diatomic gas undergoes a transition from to along a path as shown in the figure,
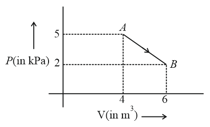
The change in internal energy of the gas during the transition is:
| Column – 1 | Column – 2 | Column – 3 |
| (I) | (i) Isothermal | (P) 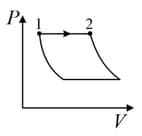 |
| (II) | (ii) Isochoric | (Q) 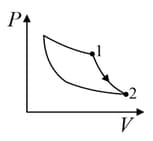 |
| (III) | (iii) Isobaric | (R) 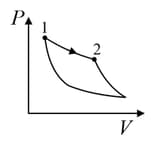 |
| (IV) | (iv) Adiabatic | (S) 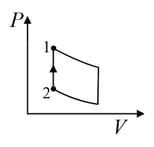 |
The three processes in a thermodynamic cycle shown in the figure are : Process is isothermal; Process is isochoric (volume remains constant); Process is adiabatic.
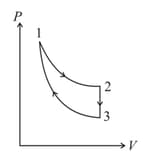
The total work done by the ideal gas in this cycle is, The internal energy decreases by, in the isochoric process. The work done by the gas in the adiabatic process is, . The heat added to the system in the isothermal process is
The given diagram shows four processes i.e., isochoric, isobaric, isothermal and adiabatic. The correct assignment of the processes, in the same order is given by:
(Take , where is gas constant)
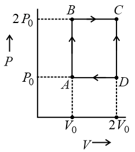
For the given cyclic process as shown for a gas, the work done is: