
MEDIUM
10th ICSE
IMPORTANT
Earn 100
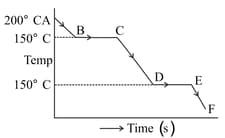
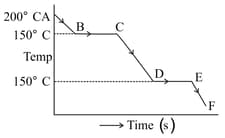
The graph represents a cooling curve for a substance being cooled from higher temperature to a lower temperature.What is the boiling point of the substance?
Important Questions on Calorimetry
EASY
10th ICSE
IMPORTANT
The graph represents a cooling curve for a substance being cooled from higher temperature to a lower temperature.What happens in the region DE. Why is the region DE shorter than the region BC?
MEDIUM
10th ICSE
IMPORTANT
MEDIUM
10th ICSE
IMPORTANT
MEDIUM
10th ICSE
IMPORTANT
MEDIUM
10th ICSE
IMPORTANT


