
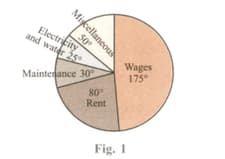
The pie chart in Figure shows the expenditure of a showroom on various heads. If the total expenditure is , find the expenditure on individual heads.
Important Questions on Data Handling III Pie Charts or Circle Graphs
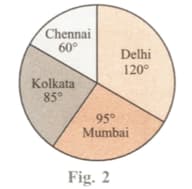
A pie chart representing the population of senior citizens in four metropolitan cities is given in Figure . If the total population of senior citizens is , read the pie chart and find the population of senior citizens in Delhi, Mumbai, Chennai and Kolkata.
Complete the table given below and then draw a pie chart to express the amount spent by five teenaged boys A, B, C, D and E on recreation, in a month.
| Boy | A | B | C | D | E | Total |
|---|---|---|---|---|---|---|
| Expenditure on recreation (in) | ||||||
| Central angle |
The given pie chart represents the different categories of wasteland in a country. If the total area of wasteland in that country is million hectares, then find the following:
The area of saline and alkaline lands.
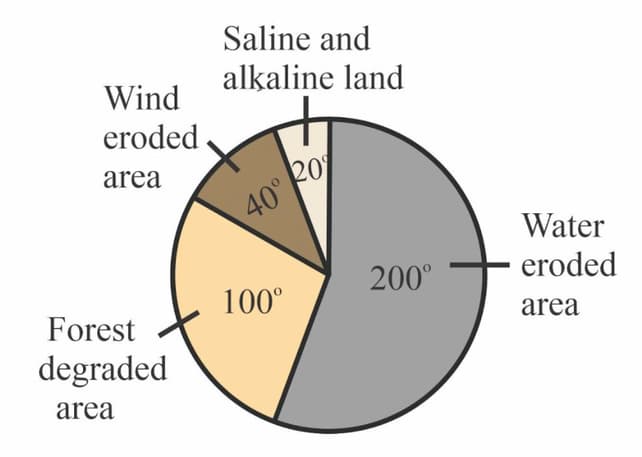
The given pie chart represents the different categories of wasteland in a country. If the total area of wasteland in that country is million hectares, then find the percentage of water eroded area. (Estimate answer to two decimal places)
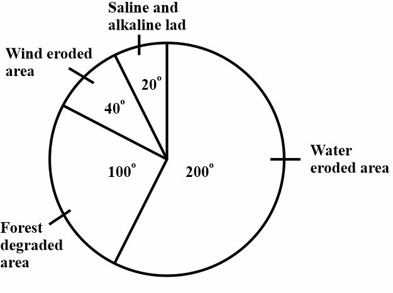
The given pie chart represents the different categories of wasteland in a country. If the total area of wasteland in that country is million hectares, then find the following:
The ratio of forest degraded area to wind eroded area.


