
The representation of data using pictures or symbols is called a .
Important Questions on Data Handling
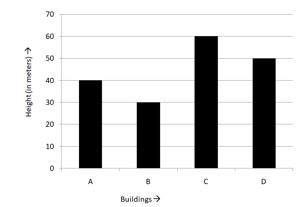
The building that is tall is
The pictograph given below shows the number of deliveries made by a florist during a week.
| Monday | 💐💐💐 |
| Tuesday | 💐💐 |
| Wednesday | 💐💐💐💐 |
| Thursday | 💐💐💐💐💐 |
| Friday | 💐💐💐 |
| Saturday | 💐💐💐💐💐💐 |
| Sunday | 💐💐💐💐💐💐💐 |
Each 💐 represents three deliveries.
The number of deliveries were maximum on
The pictograph given below shows the number of deliveries made by a florist during a week.
Each  represents deliveries represents deliveries |
|
| Monday | |
| Tuesday | |
| Wednesday | |
| Thursday | |
| Friday | |
| Saturday | |
| Sunday | |
Which two consecutive days have a total of deliveries?
The total number of students of a school in different years is shown in the following table:
| Year | |||||
| Number of students |
Prepare a pictograph of students using one symbol  to represent students and answer the following question.
How many symbols represent the total number of students in the year ?
| Year | |||||
| Number of Students |
Prepare a pictograph of students using one symbol
 to represent students and answer the following question.
How many symbols represent the total number of students in the year ?
Make a bar graph for the given data and answer the following questions:
Movie preferences of women polled at a Mall
| Comedy | Drama | Sci-Fi | Action | Thriller |
What fraction of the total number of women prefer action movies?
Following is the bar graph of the circulation of newspapers (daily) in a town in six languages. Study the bar graph and answer the following questions.
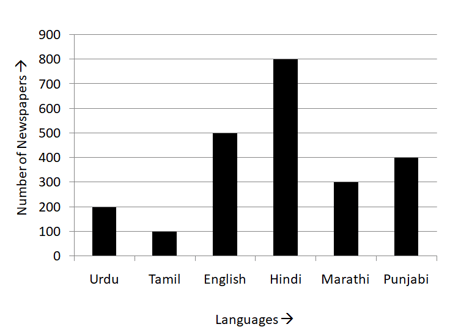
What is the difference between the number of newspapers of Hindi and English papers being read?
Find the mean of the first ten prime numbers.


