
The tables shows the ages and heights of boys and girls.
Boys:
Age (years)
Height (cm)
Girls:
Age (years)
Height (cm)
Describe the relation between age and height.
Important Questions on Presenting and Interpreting Data 2
The tables shows the ages and heights of boys and girls.
Boys:
| Age (years) | |||||||
| Height (cm) |
Girls:
| Age (years) | |||||||
| Height (cm) |
Compare the height of boys and girls.
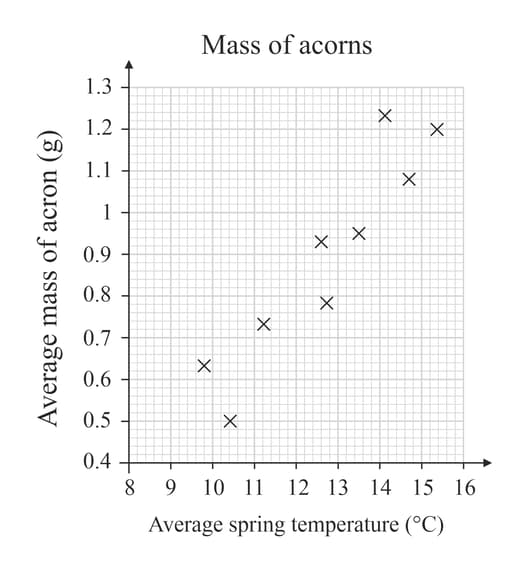
Ada has an oak tree in her garden. Her oak tree produces acorns. She collects data about the average temperature each spring and the average mass of the acorns on her tree. This information is shown on the scatter graph.
Ada concludes that acorns are heavier when the spring is warmer. Comment on Ada's conclusion.

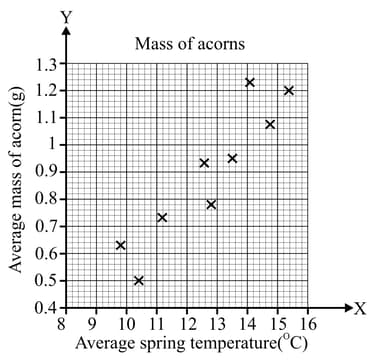
Ada has an oak tree in her garden. Her oak tree produces acorns. She collects data about the average temperature each spring and the average mass of the acorns on her tree. This information is shown on the scatter graph.
Draw a best line that fit on scatter graph.
Ada has an oak tree in her garden. Her oak tree produces acorns. She collects data about the average temperature each spring and the average mass of the acorns on her tree. This information is shown on the scatter graph.
The following spring the average temperature was 11.8°C
Use your line of best fit to estimate the average mass of an acorn on the tree.
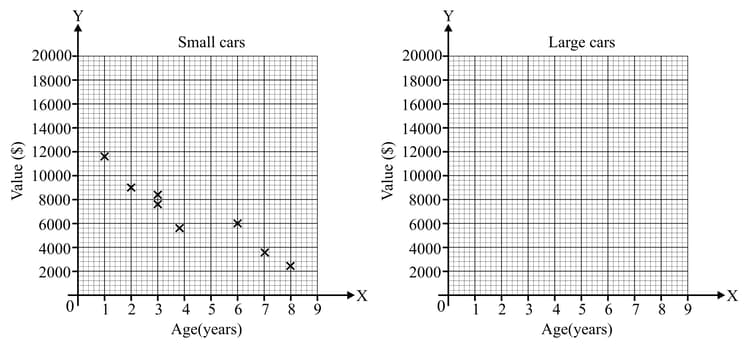
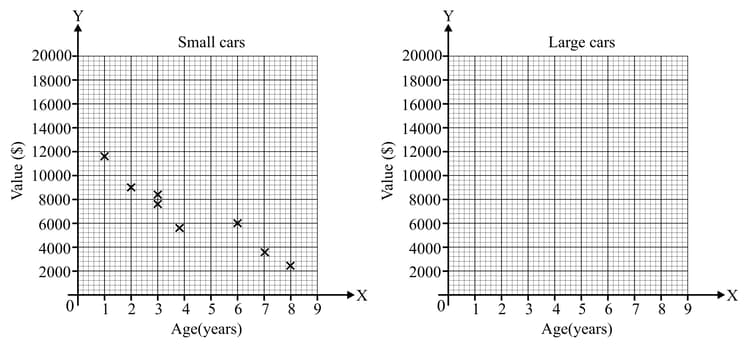
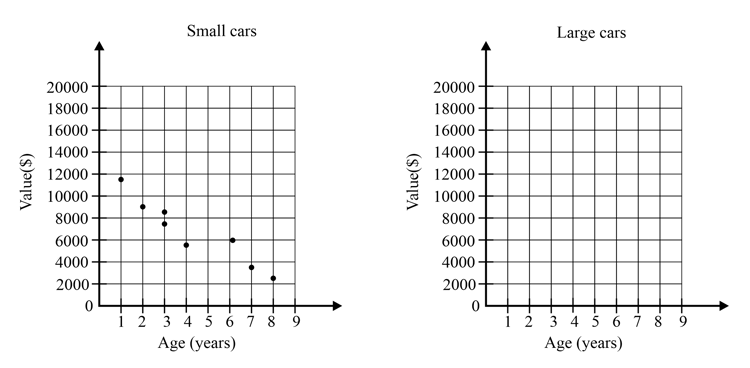
The scatter graph shows the value (in of small cars of different ages (in years). The value of large cars is shown in the table. Plot the data on the Large cars' scatter graph above.
| Age (years) | |||||||||
| Value |
The scatter graph shows the value (in of small cars of different ages (in years). The value of large cars is shown in the table.
Add a line of best fit to both scatter graphs
| Age (years) | |||||||||
| Value |
The scatter graph shows the value (in of small cars of different ages (in years). The value of large cars is shown in the table. Predict the value of a 5-year-old small car and a 5-year-old large car. Compare these values.
| Age (years) | |||||||||
| Value |


