EASY
Earn 100

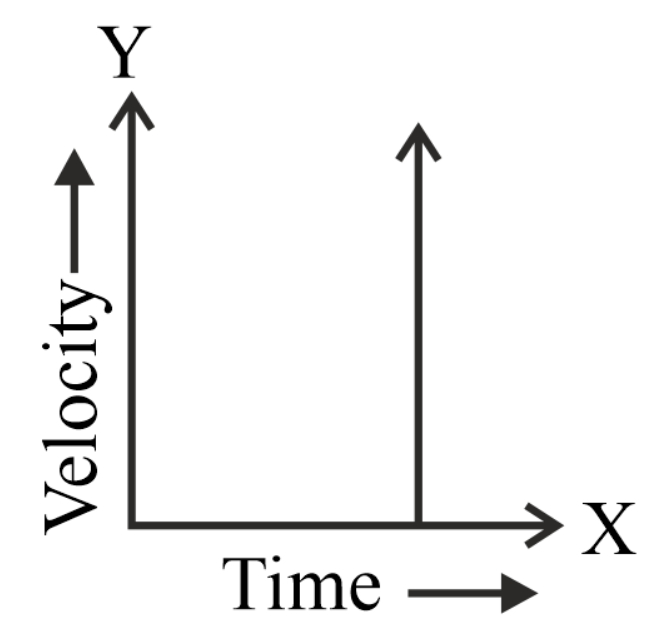
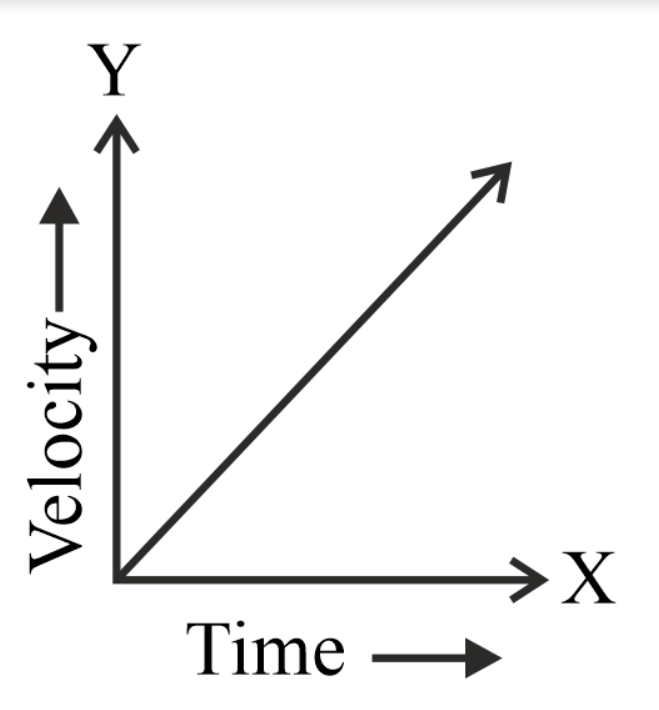
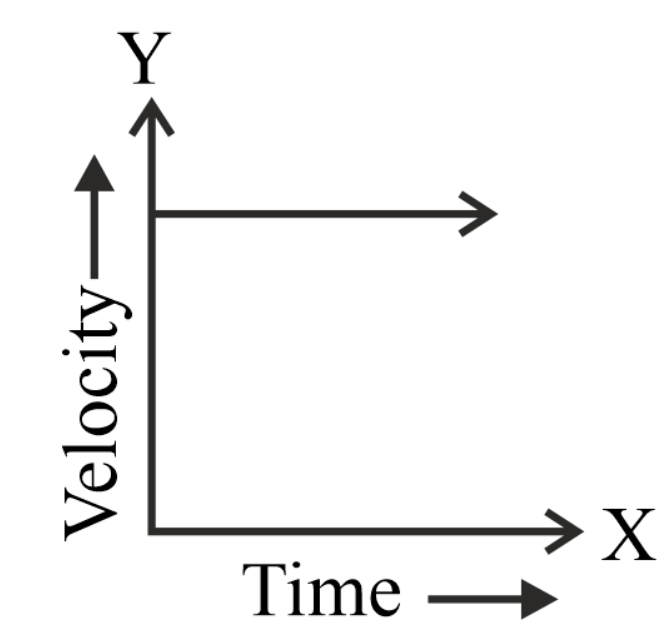
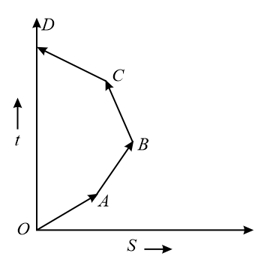
The velocity-time graph of an object moving with uniform velocity is
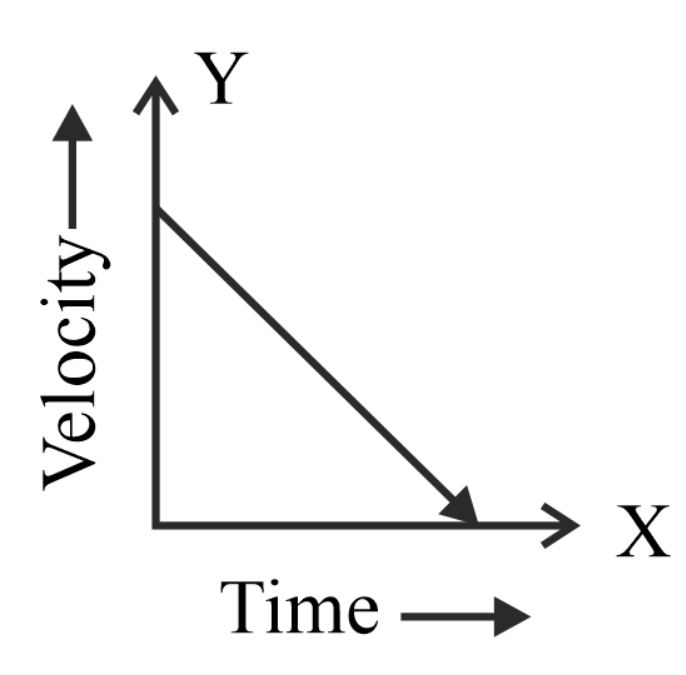
50% studentsanswered this correctly

Important Questions on Motion

MEDIUM

The velocity – time graph of a moving body is shown in the figure. Which of the following statements is true?
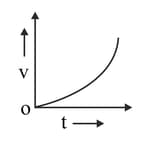
Question Image

MEDIUM
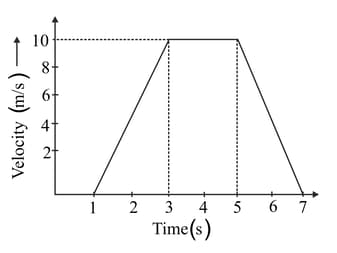
The distance travelled by a body in last two seconds of its motion in straight line is what fraction of the total distance covered in 7 seconds in the given velocity time graph?
Question Image
EASY
Which of the following options is correct for object having a straight line motion represented by the following graph?
Question Image
EASY

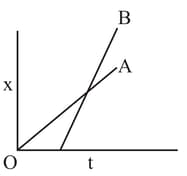
The position-time graphs for two students A and B returning from the school to their homes are shown in figure.
Question Image

(A) A lives closer to the school

(B) B lives closer to the school

(C) A takes lesser time to reach home

(D) A travels faster than B

(E) B travels faster than A

Choose the correct answer from the options given below

EASY

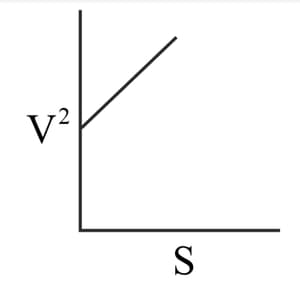
V2-S graph of the moving body in straight line is as shown in figure. Which among the following is not true?
Question Image

MEDIUM
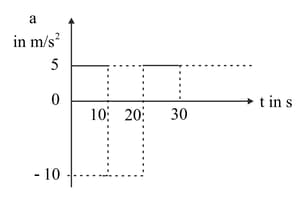
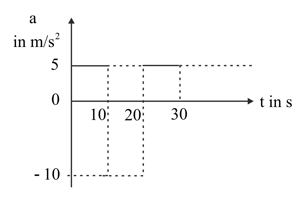
Suppose that the acceleration versus time graph of a particle that starts from rest at t=0 is as shown in the figure.
Question Image
What is the total distance travelled by the particle during 30 s?
EASY
The area enclosed by velocity-time graph and time axis by an object moving with uniform motion represents :
EASY
Figures given below show velocity – time curves for a moving object. Identify the one which may be realised in practice.
MEDIUM

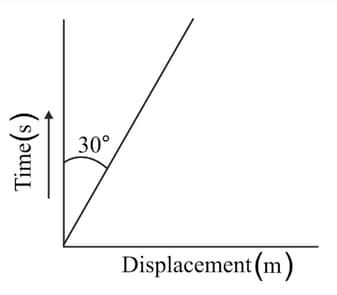
The displacement-time graph of a body in motion is given as below:
Question Image

Velocity of body is ( m s-1) :

MEDIUM
Suppose that the acceleration versus time graph of a particle that starts from rest at t=0 is as shown in the figure. 
Question Image
At what instant does the particle come to rest for the first time?
HARD

A body initially at rest start moving when a constant external force F is applied on it. The force F is applied for time t = 0 to time t = T. Which of the following graph represents the variation of the speed (v) of the body with time (t)

HARD
In the following displacement (x) vs time (t) graph at which among P, Q and R is the object's speed increasing?

Question Image
MEDIUM
A drunkard walking in a narrow lane takes 5 steps forward and 3 steps backward, followed again by 5 steps forward and 3 steps backward, and soon. Each step is 1 m long and requires 1 s. Plot the x-t graph of his motion. Determine graphically and otherwise how long the drunkard takes to fall in a pit 13 m away from the start.
EASY
For an object moving with uniform velocity, the velocity-time graph will be _____.
MEDIUM
Diagram shows the distance-time graph of three objects A, B and C. Study the graph and answer the following question.

Question Image

How far has B travelled by the time it passes C?
EASY
Diagram shows the distance-time graph of three objects A, B and C. Study the graph and answer the following question.

Question Image

How far has C travelled when B passes A ?
EASY
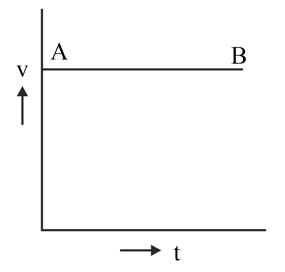
In the given velocity-time graph, AB shows that the body has _____.

Question Image
EASY
The figure shows the x-coordinate of a particle as a function of time. Find the signs of vx and ax at  t=t1t=t2 and t=t3
Question Image
EASY
Diagram shows the distance-time graph of three objects A, B and C. Study the graph and answer the following question.

Question Image

Are all three ever at the same point on the road ?
EASY
Diagram shows the distance-time graph of three objects A, B and C. Study the graph and answer the following question.

Question Image

Which of the three is travelling the fastest?