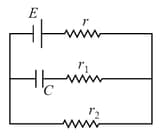
When the inductor is removed from series LCR circuit, the time constant is , when the capacitor is removed, the time constant is . The frequency of resonance of the circuit, when the resistance is removed, is
Important Questions on Electromagnetic Induction and Alternating Currents
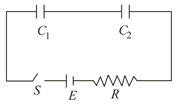
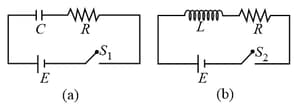
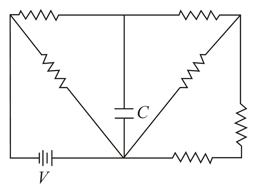
In the circuit shown below, the key is pressed at time . Which of the following statement(s) is(are) true?
Which of the statement(s) is/are correct?
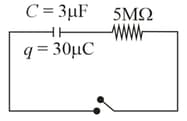
The circuit shown in the figure consists of a charged capacitor of capacity and a charge of At time when the key is closed, the value of current flowing through the resistor is The value of to the nearest integer is
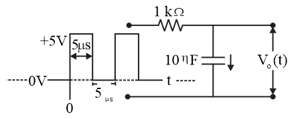
For the given input voltage waveform the output voltage waveform across the capacitor is correctly depicted by :
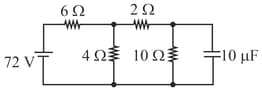
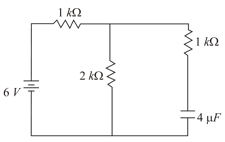
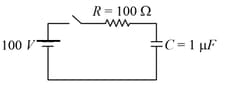
The circuit shown has been connected for a long time. The voltage across the capacitor is,
A capacitor of capacitance is suddenly connected to a battery of through a resistance The time taken for the capacitor to be charged to get is:
(Take )
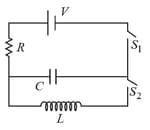
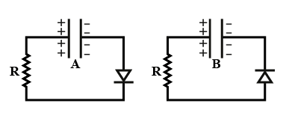
A blackbox which may contain a combination of electrical circuit elements (resistor, capacitor or inductor) is connected with other external circuit elements as shown below in the figure . After the switch is closed at time , the current as a function of time is shown in the figure .
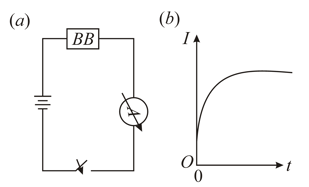
From this we can infer that the black-box contains
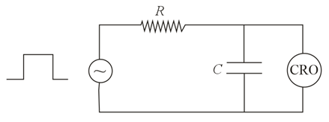
An circuit as shown in the figure is driven by a source generating a square wave. The output wave pattern monitored by would look close to :
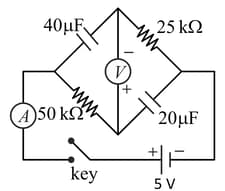
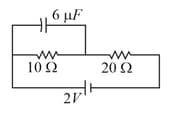
What is the charge on the capacitor in the circuit shown below?
Consider the circuit shown in the figure below:
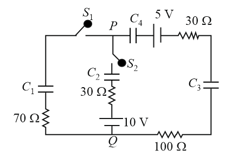
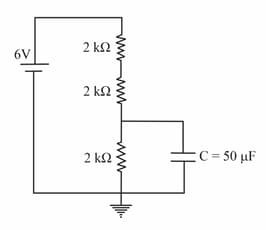
All the resistors are identical. The charge stored in the capacitor, once it is fully charged, is
In the following circuit the switch is closed at . The charge on the capacitor as a function of time will be given by