
Which graph shows how the energy E of a photon of light is related to its wavelength ?
Important Questions on Structure of Atom
(Nearest integer)
(Given: )
Following figure shows spectrum of an ideal black body at four different temperatures. The number of correct statement/s from the following is _______.
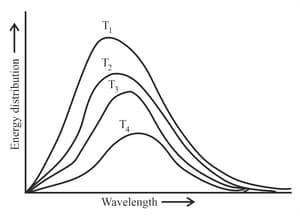
A. T4 > T3 > T2 > T1
B. The black body consists of particles performing simple harmonic motion.
C. The peak of the spectrum shifts to shorter wavelength as temperature increases.
D.
E. The given spectrum could be explained using quantisation of energy
The number of incorrect statement/s about the black body from the following is______
(A) Emit or absorb energy in the form of electromagnetic radiation.
(B) Frequency distribution of the emitted radiation depends on temperature.
(C) At a given temperature, intensity vs frequency curve passes through a maximum value.
(D) The maximum of the intensity vs frequency curve is at a higher frequency at higher temperature compared to that at lower temperature.
( = Planck's constant, = speed of light)
A watt bulb emits monochromatic red light of wavelength of . The number of photons emitted per second by the bulb is The value of is _____ .
(Nearest integer)


