
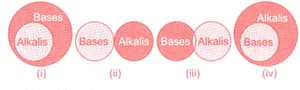
Which of the following diagram(s) represent(s) alkalis and bases in the correct form?
Important Questions on Acids, Bases and Salts
Observe the given figure carefully and select the incorrect statement(s).
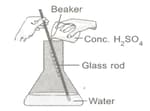
1. Large volume of acid should be added to a small volume of water slowly.
2. The figure represents the process of concentrating dilute .
3. The process involves the release of a large amount of heat.
4. Water should not be stirred.
Match column I with column II and select the correct option from the given codes.
| Column I | Column II | ||
| (P) | Ammonium hydroxide | (i) | Spinach |
| (Q) | Tartaric acid | (ii) | Window cleaner |
| (R) | Zinc carbonate | (iii) | Tamarind |
| (S) | Oxalic acid | (iv) | Calamine |
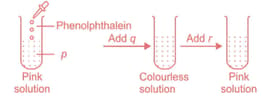
Kartik performed the following experiment by taking a few solutions and phenolphthalein indicator. Identify , and in his experiment.
The given figure shows the colour changes in test tubes I, II and III, when China rose indicator is added to them.
| I | II | III | |
| (A) | Sugar solution | Lime water | Baking powder |
| (B) | Sugar solution | Lemon juice | Vinegar |
| (C) | Lime water | Sugar solution | Lemon juice |
| (D) | Lemon juice | Sugar solution | Lime water |
Study the given table carefully:
| S.NO. | Samples | Blue litmus to red | Red litmus to blue |
| (i) | Tamarind juice |
✓ |
X |
| (ii) | Sugar syrup |
X |
✓ |
| (iii) | Lime water | X |
✓ |
| (iv) | Soap solution |
✓ |
X |
Which of the above observations are correct?
Rahul took a turmeric paper and tried to draw flowers on it with the help of cotton buds dipped in solutions and . The flower drawn with solution was not visible while one drawn with solution turned red.
Solutions and could be respectively


