
Which of the following graph represents correctly the variation in thermodynamic functions during th formation of a binary solution showing positive deviators from ideal behavior?
Important Questions on General Principles and Processes of Isolation of Metals (Metallurgy)
Given below are two statements: One is labelled as Assertion and the other is labelled as Reason
Assertion : The reduction of a metal oxide is easier if the metal formed is in liquid state than solid state.
Reason : The value of becomes more on negative side as entropy is higher in liquid state than solid state.
In the light of the above statements. Choose the most appropriate answer from the options given below
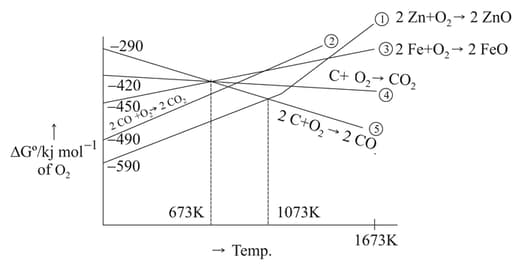
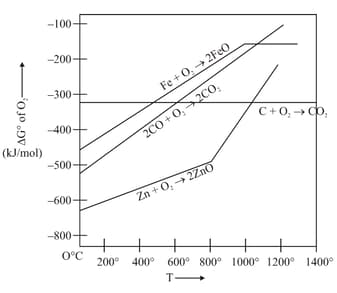
From the Ellingham diagram given below, identify the correct statements
I) Below CO can reduce FeO to Fe
II) Above Coke can reduce FeO to Fe
III CO is the strong reducing agent for the reduction of ZnO to Zn above than coke
IV) Coke reducs ZnO to Zn readily at
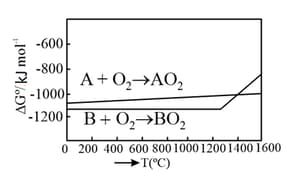
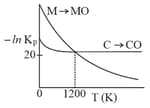
The point of intersection and sudden increase in the slope, in the diagram given below, respectively, indicates:
Given below are two statements.
Statement I: The choice of reducing agents for metals extraction can be made by using the Ellingham diagram, a plot of vs temperature.
Statement II: The value of increases from left to right in the Ellingham diagram.
In the light of the above statements, choose the most appropriate answer from the options given below:
Given below are two statements: one is labelled as Assertion A and the other is labelled as Reason
Assertion A: In an Ellingham diagram, the oxidation of carbon to carbon monoxide shows a negative slope with respect to temperature.
Reason R: CO tends to get decomposed at higher temperature.
In the light of the above statements, choose the correct answer from the options given below
For a reaction
The free energy change is plotted as a function of temperature. The temperature below which the oxide is stable could be inferred from the plot as the point at which :
An Ellingham diagram provides information about:
The reaction for obtaining the metal from its oxide ore is given by
( solid,liquid) in that case, is
Given are two statements one is labelled as Assertion and other is labelled as Reason.
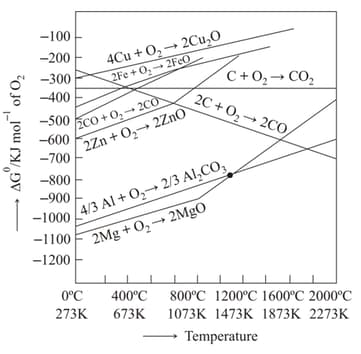
Assertion: Magnesium can reduce at a temperature below , while above aluminium can reduce .
Reason: The melting and boiling points of magnesium are lower than those of aluminium.
In light of the above statements, choose most appropriate answer from the options given below
Given below are two statements :
Statement I : According to the Ellingham diagram, any metal oxide with higher is more stable than the one with lower .
Statement II : The metal involved in the formation of oxide placed lower in the Ellingham diagram can reduce the oxide of a metal placed higher in the diagram.
In the light of the above statements, choose the most appropriate answer from the options given below
Given below are two statements: one is labelled as Assertion A and the other is labelled as Reason R
Assertion A: In the Ellingham diagram, a sharp change in slope of the line is observed from at
Reason R: There is a large change of entropy associated with the change of state
In the light of the above statements, choose the correct answer from the options given below
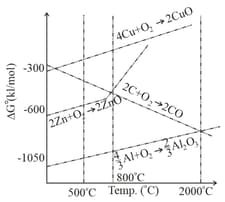
Gibbs energy vs plot for the formation of oxides is given below.
For the given diagram, the correct statement is-
and
Identify the correct statement:


