
Write any four advantages of Histograms?
Important Questions on Representation of Data
Boxes of floor tiles are to be offered for sale at a special price of The boxes claim to contain at least tiles each.
Why would it be preferable to use a stem-and-leaf diagram rather than a bar chart to represent the numbers of tiles, which are and
A fashion company selected , -year-old boys and , -year-old girls to audition as models. The heights, , of the selected children are represented in the following graph.

What features of the data suggest that the children were not selected at random?
A charity group's target is to raise a certain amount of money in a year. At the end of the first month the group raised of the target amount, and at the end of each subsequent month they manage to raise exactly half of the amount outstanding.
How many months will it take the group to raise of the money?
Name a type of representation that will show that the group fails to reach its target by the end of the year. Explain how this fact would be shown in the representation.
Last year Tom renovated an old building during which he worked for at least 9 hours each week. By plotting four points in a graph, he has represented the time he spent working.
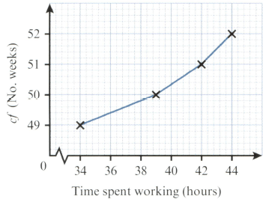
Name the different types of representation that are suitable for displaying the amount of time that Tom worked each week throughout the year.
Consider the benefits of each type of representation and then fully describe (but do not draw) the one you believe to be the most suitable.
pie chart do not easily reveal exact values
Boxes of floor tiles are to be offered for sale at a special price of The boxes claim to contain at least tiles each.
Why would it be preferable to use a stem-and-leaf diagram rather than a bar chart to represent the numbers of tiles, which are and
How may the seller benefit if the numbers and are used to draw the stem-and-leaf diagram instead of the actual numbers of tiles?
A fashion company selected -year-old boys and -year-old girls to audition as models. The heights, , of the selected children are represented in the following graph.

The shortest boys and tallest girls were recalled for a second audition. On a cumulative frequency graph, show the heights of the children who were not recalled.
Write the limitations of pie chart.
University students measured the heights of the trees in the grounds of a primary school. As part of a talk on conservation at a school assembly, the students have decided to present their data using one of the following diagrams.
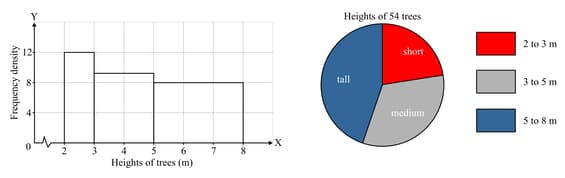
Give one disadvantage of using each of the representations shown.
The following table shows the focal lengths, , of the zoom lenses sold by a shop. For example, there are zoom lenses that can be set to any focal length between and .
| Focal length | |||||
| No. lenses |
What type of diagram could you use to illustrate the data? Explain clearly how you would do this.
A fashion company selected -year-old boys and -year-old girls to audition as models. The heights, , of the selected children are represented in the following graph.

Estimate the number of girls who are taller than the shortest boys.
A large number of chickens' eggs are individually weighed. The masses are grouped into nine classes, each of width grams, from to .
Name a type of representation in which the fact could be seen that the majority of the eggs have masses from to Explain how the representation would show this.
A fashion company selected -year-old boys and -year-old girls to audition as models. The heights, , of the selected children are represented in the following graph.
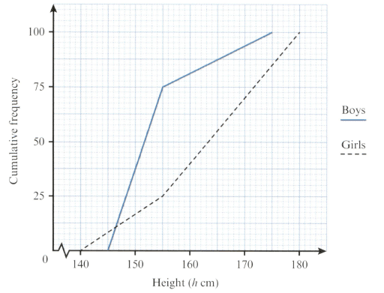
What is the significance of the value of where the graphs intersect?
The following table shows estimates, in hundred thousands, of the number of people living in poverty and the populations, in millions, of the countries where they live.
| Country | Chile | Sri Lanka | Malaysia | Georgia | Mongolia |
| No. living in poverty | |||||
| Population |
Represent, in a single diagram, the actual numbers and the relative poverty that exists in these countries.
In what way do the two sets of data in your representation give very different pictures of the poverty levels that exist? Which is the better representation to use and why?
University students measured the heights of the trees in the grounds of a primary school. As part of a talk on conservation at a school assembly, the students have decided to present their data using one of the following diagrams.

Give one disadvantage of using each of the representations shown.
Name and describe a different type of representation that would be appropriate for the audience, and that has none of the disadvantages given for above


