
Mixed Graphs
Mixed Graphs: Overview
This topic covers concepts, such as Mixed Graphs of Pie and Table Charts, Mixed Graphs of Bar and Web Charts, Mixed Graphs of Line and Pie Charts, Mixed Graphs of Bar and Table Charts, Mixed Graphs of Line and Bar Charts, Mixed Graphs, etc.
Important Questions on Mixed Graphs
Study the graphs to answer these questions.
A farmer has been growing three different crops A, B and C. Details of yields of these crops per hectare from to are depicted in the graph. The margin of profit of these crops in Rs per tonne are given in the table
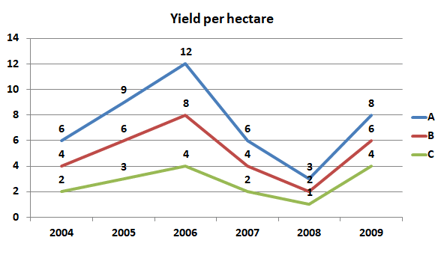
The margin of profit of these crops (in ) are given in the table.
|
Crop |
||||||
| A | ||||||
| B | ||||||
| C |
What is the percentage increase in total profit per hectare of all crops during compared to ?
Study the graph carefully and answer the questions that follow.
Break-up of employees working in various departments of an organisation and the ratio of number of men to number of women.
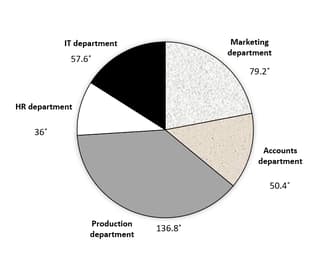
TOTAL NUMBER OF EMPLOYEES
RESPECTIVE RATIO OF NUMBER OF MEN TO NUMBER OF WOMEN IN EACH DEPARTMENT.
| Department | Men | women |
| Production | ||
| HR | ||
| IT | ||
| marketing | ||
| Accounts |
What is the total number of men working in the organisation?
Study the given bar graph and pie chart to answer the following questions:
The bar graph shows the production (in a thousand tones) of Wheat, Rice and Maize in different states,
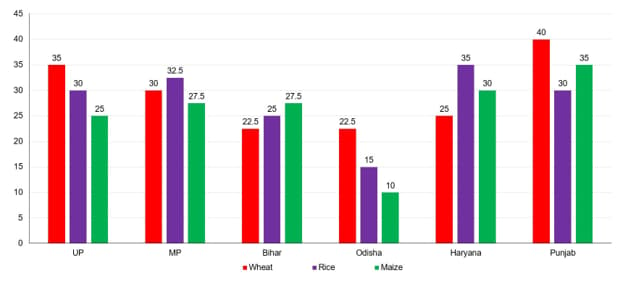
The pie-chart shows the percentage of agricultural land in the given six states,
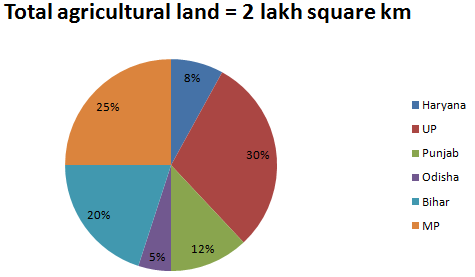
What is the ratio of the production of Rice in Bihar to the production of Wheat in Haryana?
Study the following pie chart and table and answer the questions given below:
Percentage of students pursuing different specialization
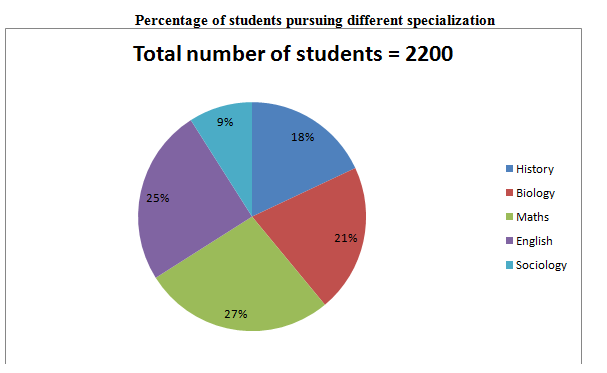
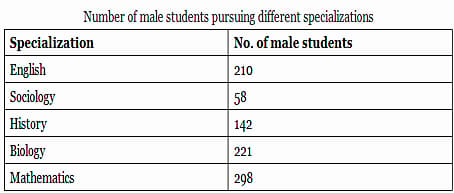
The number of female students pursuing Sociology is approximately what percent of the number of students pursuing History and Mathematics together?
Study the following graph carefully and answer the question:
The below bar graph shows the percentage of males and females in the five organisations,

The total number of employee
The below pie chart shows the percentage of employees in the five organisations,

The number of employees in organisation C is approximately what per cent of the total number of employees in organisation D?
Study the graph carefully and answer the questions that follow.
Break-up of employees working in various departments of an organisation and the ratio of number of men to number of women.
TOTAL NUMBER OF EMPLOYEES .

RESPECTIVE RATIO OF NUMBER OF MEN TO NUMBER OF WOMEN IN EACH DEPARTMENT.
| Department | Men | women |
| Production | ||
| HR | ||
| IT | ||
| marketing | ||
| Accounts |
Study the graph carefully and answer the questions that follow.
Break-up of employees working in various departments of an organisation and the ratio of number of men to number of women.

TOTAL NUMBER OF EMPLOYEES
RESPECTIVE RATIO OF NUMBER OF MEN TO NUMBER OF WOMEN IN EACH DEPARTMENT.
| Department | Men | women |
| Production | ||
| HR | ||
| IT | ||
| marketing | ||
| Accounts |
What is the ratio of the number of men working in the IT department to the number of women working in the HR department?
Study the graphs carefully and answer the questions that follow.
Total number of children in different schools and the percentage of girls in them Number of Children
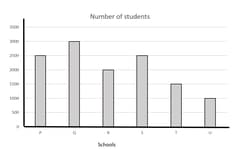
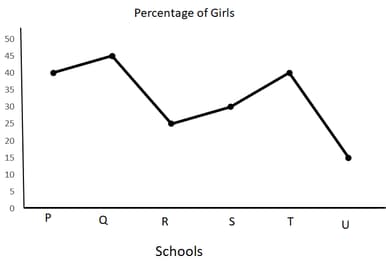
What is the total percentage of boys in schools R and U together? (rounded off to two digits after decimal)
Study the graphs carefully and answer the questions that follow.
Total number of children in different schools and the percentage of girls in them Number of Children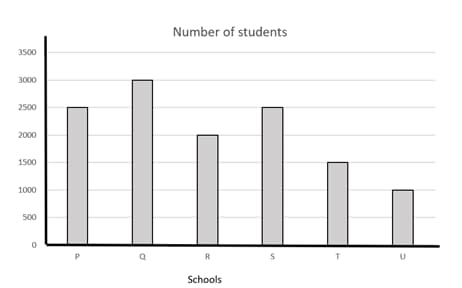
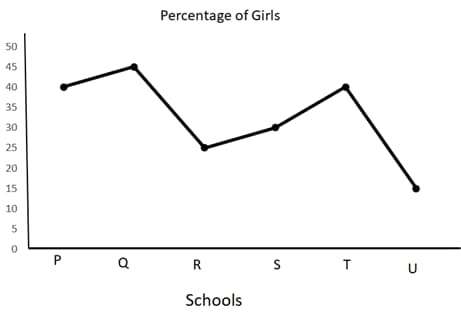
The total number of students in school R is approximately what percent of the total number of students in school S.
Study the following graph carefully and answer the question:
The below bar graph shows the percentage of males and females in the five organisations,

The total number of employee
The below pie chart shows the percentage of employees in the five organisations,
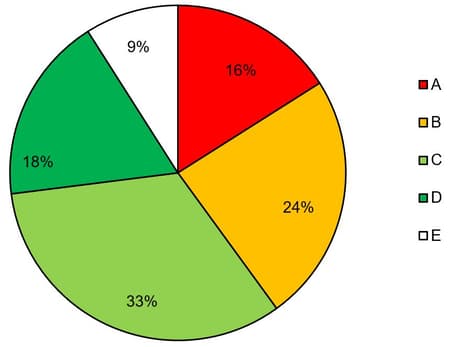
What is the total number of females in all the organisation together?
Study the graphs carefully and answer the questions that follow.
Total number of children in different schools and the percentage of girls in them Number of Children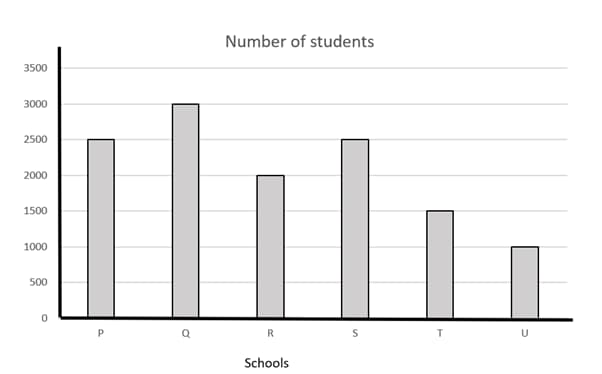
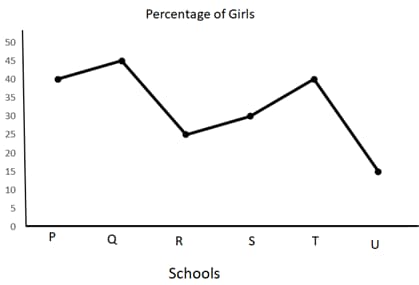
What is the total number of boys in school T?
Study the following graph carefully and answer the question:
The below bar graph shows the percentage of males and females in the five organisations,
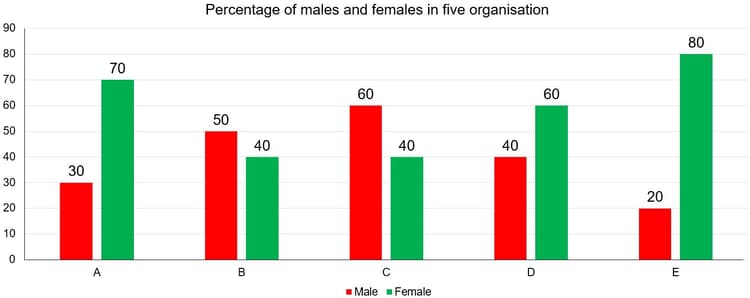
The total number of employee
The below pie chart shows the percentage of employees in the five organisations,

What is the total number of females in organisation A and C together?
Study the pie-chart and line graph carefully to answer the given questions
The pie chart shows the percentage of train accidents in different years
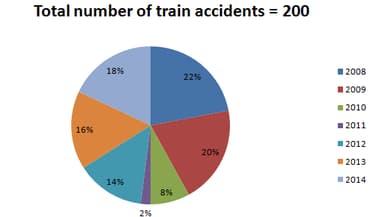
The line graph shows the number of persons who died in train accidents in various states in different years
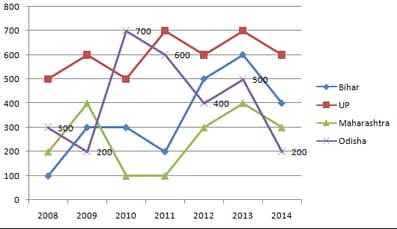
The number of persons who died in train accidents in is how much percent more than the number of persons who died in the train accident in ?
Study the graphs carefully and answer the questions that follow.
Total number of children in different schools and the percentage of girls in them Number of Children

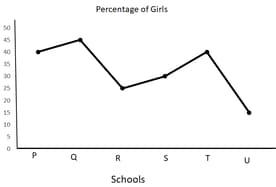
What is the average number of boys in schools P and Q together?
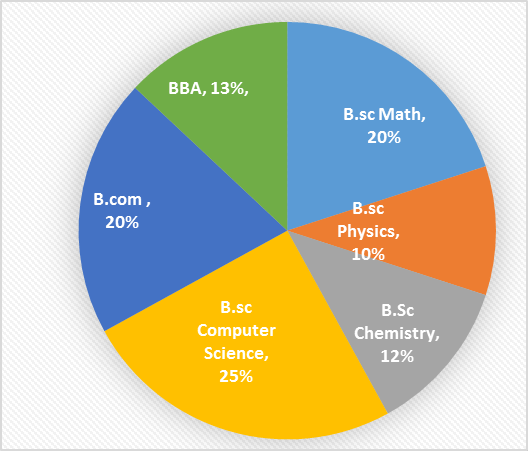
Study the given pie chart and answer the question that follows.
Total number of students admitted in a college
Distribution of the percentage of students in various courses.
 .
.
Percentage-wise distribution of the number of boys.
| Course | Number of boys |
| B.sc Math | |
| B.sc Physics | |
| B.sc Computer Science | |
| B.com | |
| B.sc Chemistry | |
| BBA |
The difference between the number of boys and the number of girls admitted in B.Com. is:
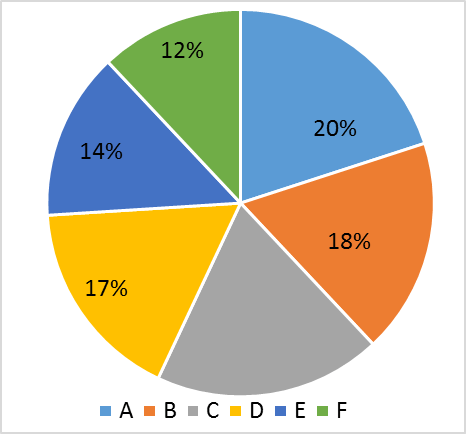
The following pie chart represents the percentage-wise distribution of students of class X in a school in six different sections A, B, C, D, E and F.

The given table shows the number of boys of class X in six different sections A, B, C, D, E and E.
| Section | A | B | C | D | E | F |
| No. of boys | ___ |
The total number of boys in sections A, B and D together is what pecentage more than the total number of girls in section A, B and D together?
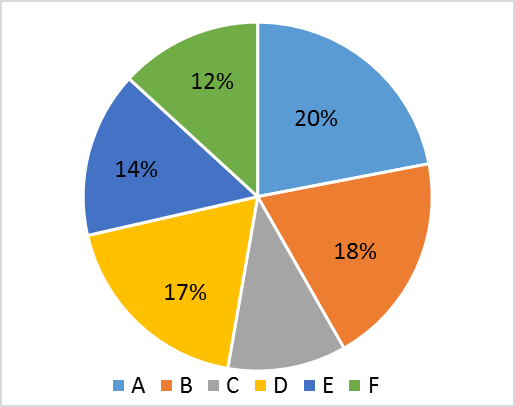
The given pie chart represents the percentage-wise distribution of students of class X in a school in six different sections A, B, C, D, E and F.
 .
.
The given table shows the number of boys of class X in six different sections A, B, C, D, E and F.
| Sections | A | B | C | D | E | F |
| No. of boys |
If in section E, the ratio of boys and girls is , then the ratio of the number of girls in section B to that of the number of girls in section E is:
Study the given pie chart and table and answer the question that follows.
The pie chart represents the percentage wise distribution of students of class is a school in six different sections A, B, C, D, E, and F.
 .
.
The table shows the number of boys of class X in six different sections A, B, C, D, E, and F.
| Section | A | B | C | D | E | F |
| No. of boys |
If the total number of students in section C is , then the total number of girls in section C and D together will be:
Study the given pie chart and answer the question that follows.
Total number of students admitted in a college
Distribution of the percentage of students in various couses.
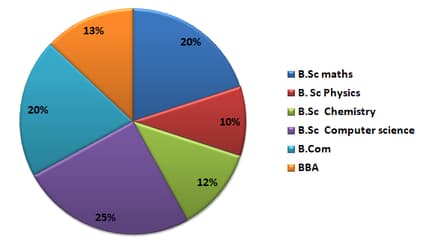
Percentage-wise distribution of the number of boys.
| Course | Number of boys |
| B.Sc. Maths | |
| B.Sc. Physics | |
| B.Sc. Chemistry | |
| B.Sc. Computer science | |
| B.Com | |
| BBA |
The ratio of the total number of girls admitted in B.Sc maths to the total number of students admitted in B.Sc maths is_____.
The given bar graph presents a country's exports (in million rupees) during , and the table that follows shows the break-up of goods exported in a year.
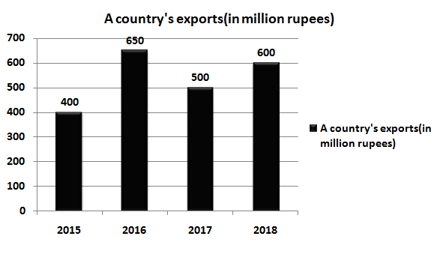
Break-Up of Goods Exported in a year
| Computers | |
| Garments | |
| Textiles | |
| Cosmetics | |
| Jewellery |
Total exports of Jewellery in and is what percent of the total exports of textiles in and ?


