Population
Population: Overview
This topic covers concepts such as Population, Population versus Species, Population Attributes, Birth Rate, Death Rate, Age Structure, Population Dispersal, Sex Ratio, Population Growth, Population Growth Curve, Population Ecology, etc.
Important Questions on Population
In a pond, there were 40 lotus plants. After a year, the number rose to 56. The birth rate of a lotus plant would be:
Essential information that can be obtained by studying the population density of an organism is,
Which of the following variable is not involved in the exponential growth curve?
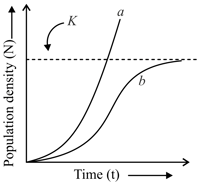
In the population growth curves shown below, ‘a’ and ‘b’ is representing:

Explain the causes of population dispersal.
_____ (Inbreeding depression/Communalism) is the cause for the population dispersal.
The avoidance of inbreeding is one of the cause for population inbreeding.
Gender has no role in the determination of sex ratio of a population.
Population and species are the same in terms of meaning.
Differentiate between population and species.
Population ecology is linked to population genetics and _____.
How are population ecology related to population genetics?
How is population ecology linked to evolution?
Which of the following deals with the interaction of populations with their environment?
Population ecology deals with the study of the interaction of the population with its environment which is further linked with population genetics and evolution.
Define species-area relationship. What is the significance of the slope of regression? Show with the help of a graph?
