
Ellingham Diagrams
Ellingham Diagrams: Overview
This topic covers concepts, such as Ellingham Diagram, Applications of Ellingham Diagram, and Limitations of Ellingham Diagram.
Important Questions on Ellingham Diagrams
Given below are two statements: one is labelled as Assertion A and the other is labelled as Reason R
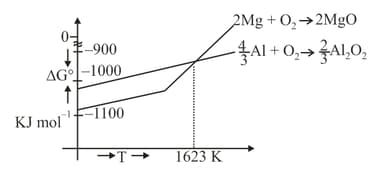
Assertion A: In the Ellingham diagram, a sharp change in slope of the line is observed from at
Reason R: There is a large change of entropy associated with the change of state
In the light of the above statements, choose the correct answer from the options given below
Given below are two statements related to Ellingham diagram :
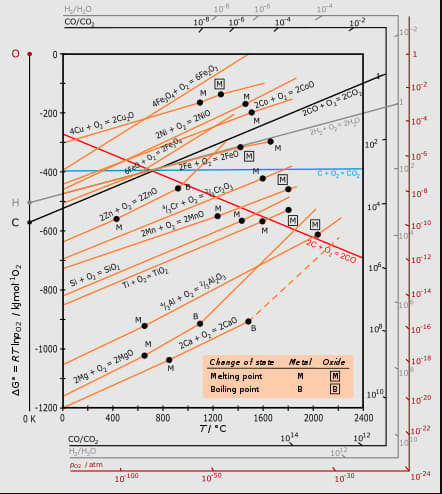
Statement I : Ellingham diagrams can be constructed for formation of oxides, sulphides and halides of metals.
Statement II : It consists of plots of vs for formation of oxides of elements.
In the light of the above statements, choose the most appropriate answer from the options given below :
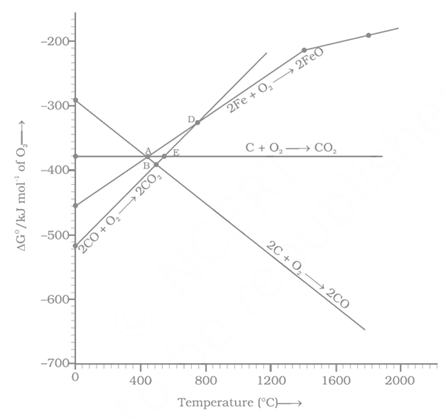
Gibbs energy vs plot for the formation of oxides is given below.
For the given diagram, the correct statement is-
Statement 1: In Elingham diagram, the change in slope for reaction occurs at .
Statement 2: Sudden change in entropy also occurs at .
Consider the following reaction at .
Choose the correct statement at .
Which of the following statements about the Ellingham Diagram (ED) is FALSE?
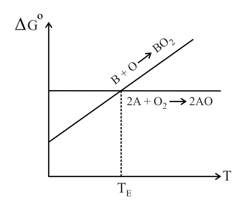
The Ellingham diagram is given for the gaseous oxides and . (Assume A and B are solid metals)
Which of the following are false about the Ellingham diagram?
The plot of versus temperature for the formation of oxides of elements is called
Which of the following statement is incorrect?
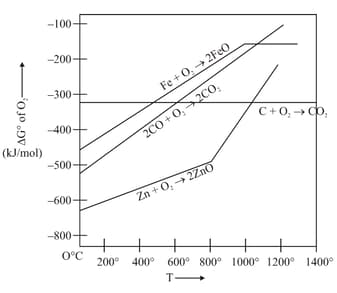
In Ellingham diagrams of oxide formation which of the following graphs has negative slope?

Which of the following statement is correct w.r.t. the following graph?
Ellingham diagrams are plots of for the formation of:
Below point can _____.
Which of the following metals cannot be obtained by reduction of its metal oxide by aluminium?
Ellingham diagram represents change of
Considering Ellingham diagram, which of the following metals can be used to reduce alumina?
vs plot in the Ellingham diagram sloper downwards for the reaction :-
In Ellingham diagram, the slope of curve of the formation of metal oxide :
Considering Ellingham diagram, which of the following metals can be used to reduce alumina?
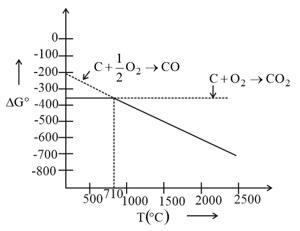
Which of the following are incorrect on basis of above ellingham diagram for carbon?


