Other Non-Linear Graphs
Other Non-Linear Graphs: Overview
In this topic, we discuss plotting cubic graphs, sketching cubic functions. We learn using graphs to solve higher-order equations. It further talks about exponential graphs using several examples.
Important Questions on Other Non-Linear Graphs
The population of bedbugs in New York City is found to be increasing exponentially. The changes in population are given below.
Use the given data and answer the following question.
| Time (months) | |||||
| Population |
What will the bedbug population be after six months if it continues to increase at this rate?
The population of bedbugs in New York City is found to be increasing exponentially. The changes in population are given below.
Use the given data and answer the following question.
| Time (months) | |||||
| Population |
When did the bedbug population reach ?
The population of bedbugs in New York City is found to be increasing exponentially. The changes in population are given below.
Use the given data and answer the following question.
| Time (months) | |||||
| Population |
Plot the graph.
The temperature of metal in a smelting furnace increases exponentially as indicated in the following table.
Use the given data and plot the graph.
| Time (min) | |||||
| Temp |
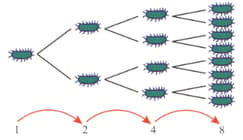
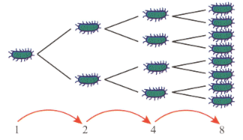
Bacteria multiply rapidly because a cell divides into two cells and then those two cells divide to each produce two more cells and so on. The growth rate is exponential and we can express the population of bacteria over time using the formula ( is the period of time).
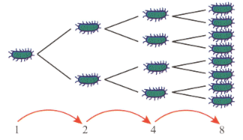
The graph shows the increase in bacteria numbers in a six-hour period.
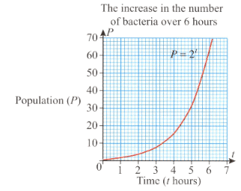
When would you expect the population to exceed one million bacteria if it continued to grow at this rate?
Bacteria multiply rapidly because a cell divides into two cells and then those two cells divide to each produce two more cells and so on. The growth rate is exponential and we can express the population of bacteria over time using the formula ( is the period of time).
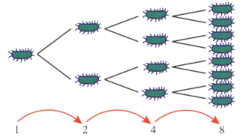
The graph shows the increase in bacteria numbers in a six-hour period.
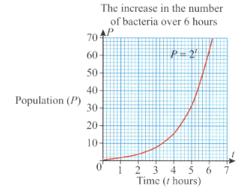
How many cells will there be after six hours?
Bacteria multiply rapidly because a cell divides into two cells and then those two cells divide to each produce two more cells and so on. The growth rate is exponential and we can express the population of bacteria over time using the formula ( is the period of time).
The graph shows the increase in bacteria numbers in a six-hour period.
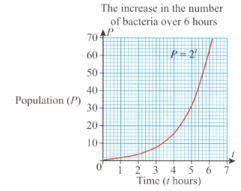
How long does it take for the number of bacteria to exceed cells?
Bacteria multiply rapidly because a cell divides into two cells and then those two cells divide to each produce two more cells and so on. The growth rate is exponential and we can express the population of bacteria over time using the formula ( is the period of time).
The graph shows the increase in bacteria numbers in a six-hour period.
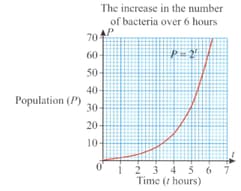
How many bacteria are there after one hour?
Mae finds the following explanation on the Internet.
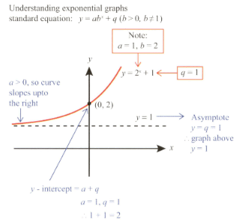
Sketch and label .
Mae finds the following explanation on the Internet.
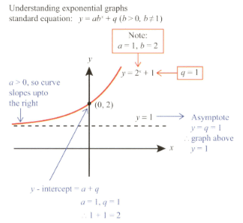
Sketch and label .
Mae finds the following explanation on the Internet.
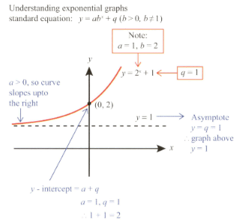
Sketch and label .
Mae finds the following explanation on the Internet.
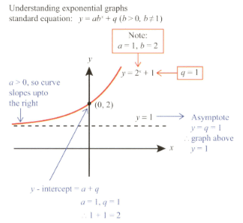
Read the information carefully and write a step-by-step set of instructions for sketching an exponential graph.
The graph of for is shown here
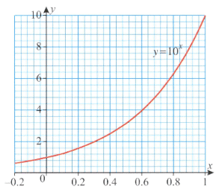
Find the value of .
The graph of for is shown here
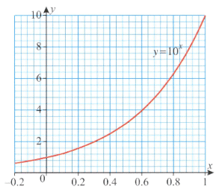
Find the value of .
Find out the relationship between the graph of .
Draw the graph of for values between .
Draw the graph of for values between .
Make a table of values for for the following equation and draw the graph.
Include negative and positive values of .
Make a table of values for for the following equation and draw the graph.
Include negative and positive values of .
Make a table of values for for the following equation and draw the graph.
Include negative and positive values of .
