
Pie Charts
Important Questions on Pie Charts
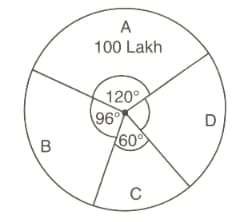
A pie chart representing the population of four cities is shown here. Read the pie chart and find the population of the city D in lakhs
The following table shows how a student spends his pocket money during the course of a month
| Items | Food | Entertainment | Other expenditures | Savings |
| Expenditure |
Represent it by a pie-diagram.
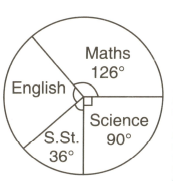
A school has a strength of students. The pie graph alongside shows the interests of students in different subjects. The number of students interested in English is
The pie chart shows the number of participants of countries and taking part in a tennis tournament. Calculate the percentage of participants
The marks obtained by a student in different subjects are shown. Draw a pie diagram showing the information.
| Subject | English | Marathi | Science | Mathematics | Social science | Hindi |
| Marks |
Draw a pie chart for the percent of money spent on various types of books by a library in one year.
| Type of book | Fiction | Classics | Sports | Biography | Magazines | Others |
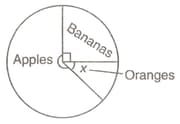
The pie chart shows the number of fruits sold in a store. If the number of bananas sold is and the number of apples sold is , what is the value of ?
The pie chart shows how a pupil spends his/her time in a Maths lesson which lasts 60 minutes.

He/she spends 3 minutes working. What is the angle on the pie chart for the time spent working?
The pie chart shows how a pupil spends his/her time in a Maths lesson which lasts 60 minutes.
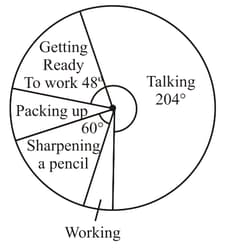
How much time does he/she spend:
sharpening pencil?
The pie chart shows how a pupil spends his/her time in a Maths lesson which lasts 60 minutes.

How much time does he/she spend:
talking
The pie chart shows how a pupil spends his/her time in a Maths lesson which lasts 60 minutes.
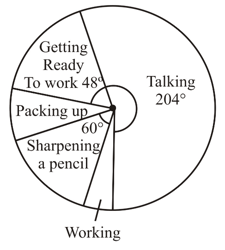
How much time does he/she spend:
getting ready to work
A sector angle of means that the particular data occupies of the pie chart.
Write the formula for calculating the central angle for a sector (representing a part of data) in a pie graph?
What is the graph that represents data as part of a circle, called?
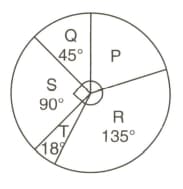
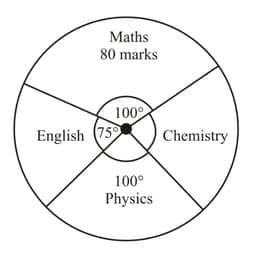
A pie diagram of the marks secured by a student in Maths, English, Physics and Chemistry is shown here. Read the graph and find the marks in Chemistry secured by the student.
Draw the pie chart to represent the following information, first working out the angles.
The number of books lent out by a school library each day
| Days | Mon | Tues | Wed | Thurs | Fri |
|---|---|---|---|---|---|
| No of books lent |
The number of students in a hostel speaking different languages is given below. Represent the data in a pie chart.
| Languages | Hindi | English | Marathi | Tamil | Bengali | Total |
|---|---|---|---|---|---|---|
| Number of students |


