Calculating Probability from Tree Diagrams
Calculating Probability from Tree Diagrams: Overview
The topic elucidates possible outcomes in calculating possibility after tossing a coin or dice which is shown using a tree diagram. The probability of getting combined events is stated with rules and formulas along with examples to practice.
Important Questions on Calculating Probability from Tree Diagrams
Dan either walks or cycles to school. The probability that he cycles to school is . When Dan cycles to school the probability that he is late is . Calculate the probability that Dan is not late.
Dan either walks or cycles to school. The probability that he cycles to school is . When Dan cycles to school the probability that he is late is . Calculate the probability that Dan cycles to school and is late.
Dan either walks or cycles to school. The probability that he cycles to school is . When Dan cycles to school the probability that he is late is . When Dan walks to school the probability that he is late is . Complete the tree diagram.
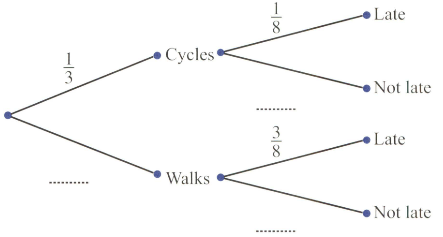
Dan either walks or cycles to school. The probability that he cycles to school is . Write down the probability that Dan walks to school.
A box contains red pencils and blue pencils. A pencil is chosen at random and not replaced. A second pencil is then chosen at random.
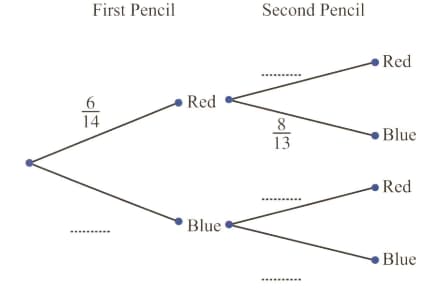
Calculate the probability that both pencils are red.
A box contains red pencils and blue pencils. A pencil is chosen at random and not replaced. A second pencil is then chosen at random.
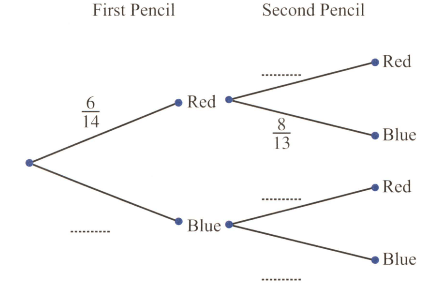
Calculate the probability that at least one of the pencils is red.
A box contains red pencils and blue pencils. A pencil is chosen at random and not replaced. A second pencil is then chosen at random.
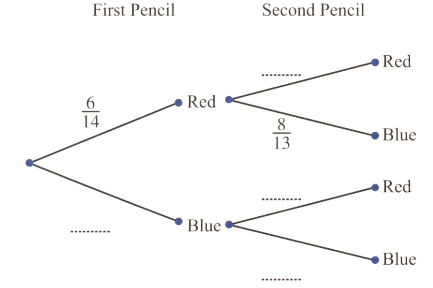
Complete the above tree diagram.
The tree diagram shows the possible outcomes when three number cards are placed in a container and then a card is drawn at random three times. Each time a card is drawn, it is placed on the table next to the previous card drawn.
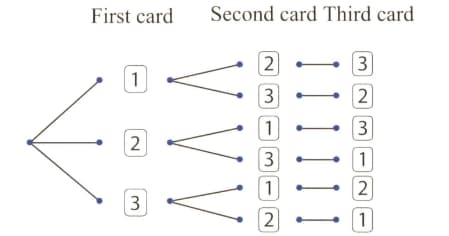
What is the probability of the three digit being ?
The tree diagram shows the possible outcomes when three number cards are placed in a container and then a card is drawn at random three times. Each time a card is drawn, it is placed on the table next to the previous card drawn.
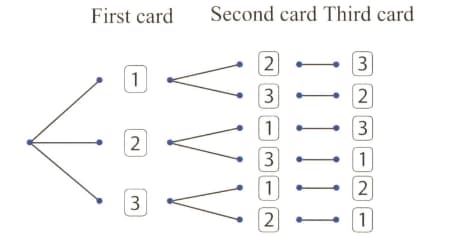
What is the probability of the three digit being divisible by ?
The tree diagram shows the possible outcomes when three number cards are placed in a container and then a card is drawn at random three times. Each time a card is drawn, it is placed on the table next to the previous card drawn.
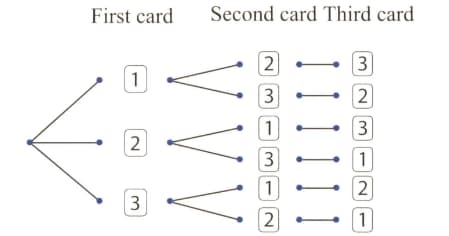
What is the probability of the three digit being even?
The tree diagram shows the possible outcomes when three number cards are placed in a container and then a card is drawn at random three times. Each time a card is drawn, it is placed on the table next to the previous card drawn.
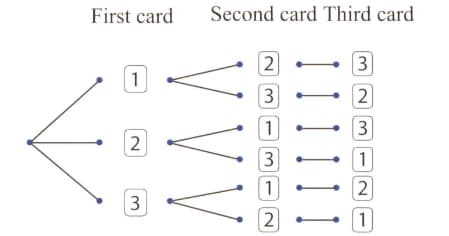
What is the probability of the three digit being ?
The tree diagram shows the possible outcomes when three number cards are placed in a container and then a card is drawn at random three times. Each time a card is drawn, it is placed on the table next to the previous card drawn.
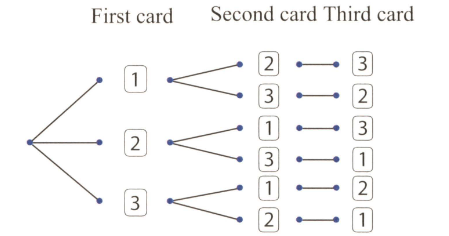
How many three digits can be formed in this experiment?
The tree diagram shows the possible outcomes when three number cards are placed in a container and then a card is drawn at random three times. Each time a card is drawn, it is placed on the table next to the previous card drawn.
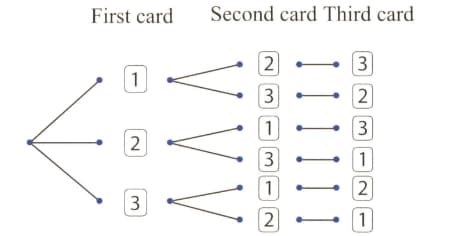
Fill in the probabilities on each branch.
