
Mixed Graphs
Mixed Graphs: Overview
This topic covers concepts, such as, Mixed Graphs, Mixed Graphs of Line and Pie Charts, Mixed Graphs of Bar and Web Charts & Mixed Graphs of Web and Table Charts etc.
Important Questions on Mixed Graphs
The following pie chart represents the percentage-wise distribution of students of class X in a school in six different sections A, B, C, D, E and F.
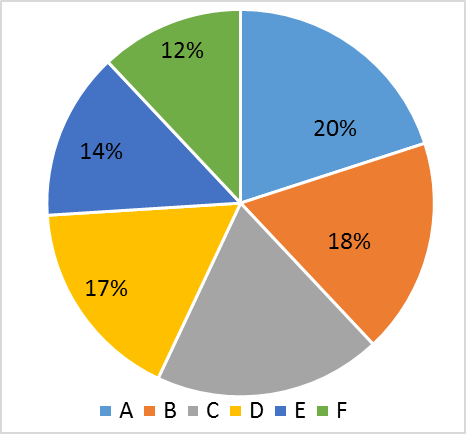
The given table shows the number of boys of class X in six different sections A, B, C, D, E and E.
| Section | A | B | C | D | E | F |
| No. of boys | ___ |
The total number of boys in sections A, B and D together is what pecentage more than the total number of girls in section A, B and D together?
The ratio of number of females in the area to that in the area is-
The number of males in the areas and together is-
Refer to the data below and answer the question that follow :
Percentage of employees working in the different divisions of Bharat Heavy Electricals limited. Total number of employees is 45000.
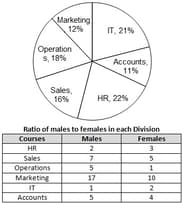
How many males are working in the Bharat Heavy Electricals limited?
Refer to the data below and answer the question that follow :
Percentage of employees working in the different divisions of Bharat Heavy Electricals limited. Total number of employees is 45000.

The number of females working in Sales Division is approximately what percent of the total number of employees in the Bharat Heavy Electricals limited?
Refer to the data below and answer the question that follow :
Percentage of employees working in the different divisions of Bharat Heavy Electricals limited. Total number of employees is 45000.

What is the total number of males working in the Marketing and Operations Divisions of the Bharat Heavy Electricals limited?
Refer to the data below and answer the question that follow :
Percentage of employees working in the different divisions of Bharat Heavy Electricals limited. Total number of employees is .
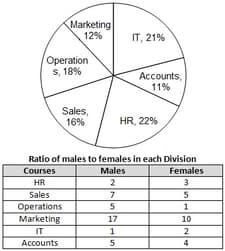
In which of the following division does the minimum number of females work ?
Study the pie-charts carefully to Answer the Question that follow :
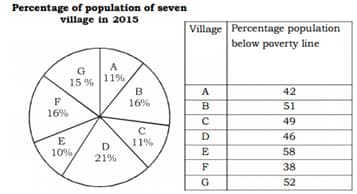
Find the ratio of total population of village D to that of village C below the poverty line
Read the following graph carefully and answer the question given below.
If the number of students in Patna constitutes of the students in all the cities surveyed, then what is the number of the students in all the cities surveyed?
Read the following graph carefully and answer the question given below.
If the number of students in the government schools in Mumbai weighing Kg equal to all the students in Mumbai weighing Kg, then what is the number of the students in private schools having a weight in the range of Kg? (assume all students study in government or private schools only)
Find the population of village C if the population of village F below poverty line in 2015 is 12160.
Study the pie-charts carefully to Answer the Questions that follow:
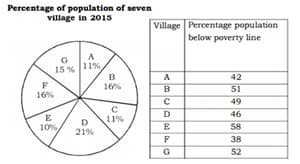
The ratio of population of village D below poverty line to that of village A below poverty line in is_____


