
Interpreting Graphs and Tables
Interpreting Graphs and Tables: Overview
This topic covers concepts, such as, Rose Diagrams, Correlation, Significance of Correlation, Types of Correlation, Simple (Linear) Correlation in 2 Variables, Positive Correlation, Negative Correlation, Uncorrelated & Conjectures etc.
Important Questions on Interpreting Graphs and Tables
A _____ correlation is a relationship between two variables that tend to move in the opposite direction.
A _____ correlation is a relationship between two variables that tend to move in the same direction.
Correlation is said to be _____ if the ratio of change is constant
_____ is a statistical measure that expresses the extent to which two variables are linearly related.
Explain simple (linear) correlation in variables with types?
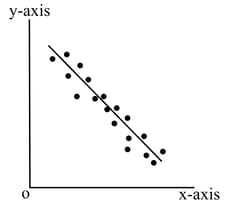
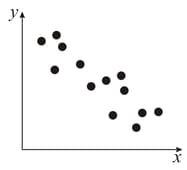
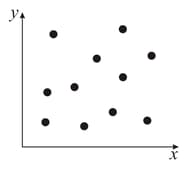
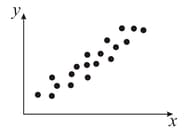
The type of correlation existing between the variables in the graph is
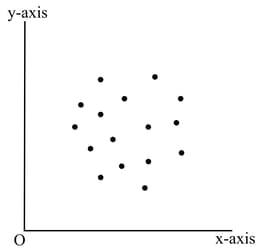
The type of correlation existing between the variables in the graph is
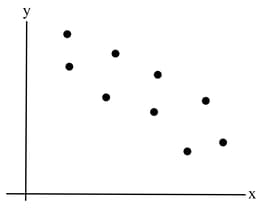
The type of correlation existing between the variables in the graph is
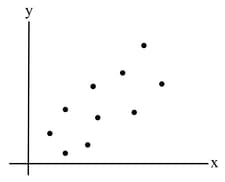
The type of correlation existing between the variables in the graph is
The following graph has
The following graph has
The following graph has
The height and weight of a group of persons will have
Comment on correlation of given data:
The correlation coefficient of given data is
Find the correlation ocefficient of given data
This is a positive correlation
Find the correlation of the given data:
What is simple (linear) correlation in variables?
What is no correlation? Give few examples.


