Dual and Compound Bar Charts
Dual and Compound Bar Charts: Overview
This topic covers concepts, such as, Bar Graph, Understanding a Bar Graph, Drawing a Double Bar Graph, A Double Bar Graph of Data & Understanding Compound Bar Graph etc.
Important Questions on Dual and Compound Bar Charts
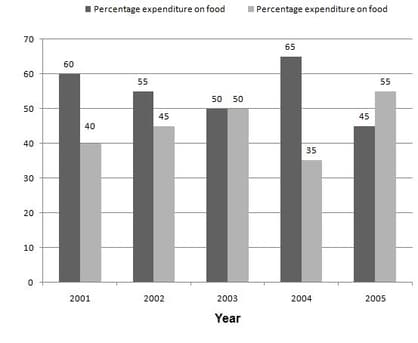
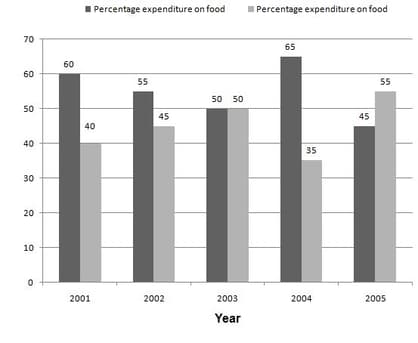
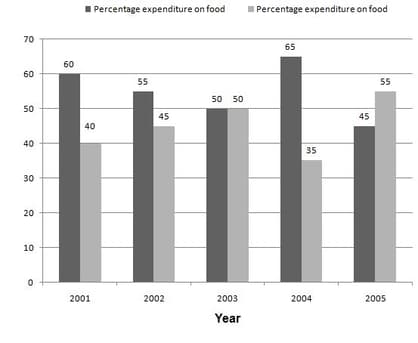
The given bar-graph shows the percentage expenditure of a person on food and education items for five years and the table given below shows the total expenditure of that person for these five years.
| Year | Expenditure |
In which year there was the highest increases over the preceding year in the amount of money spend on education?
The given bar-graph shows the percentage expenditure of a person on food and education items for five years and the table given below shows the total expenditure of that person for these five years.
| Year | Expenditure |
Study the following graph which shows the income and expenditure of a company over the years and answer questions.
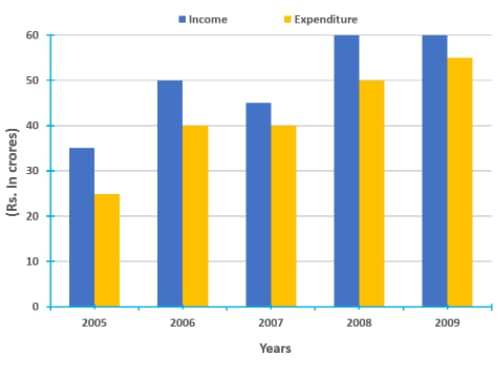
The percentage increase in income of the company from to is:
The bar chart representing the number of first-year B.Com. Students of St. Xavier's College using different companies' smartphones. Study bar chart and answer.
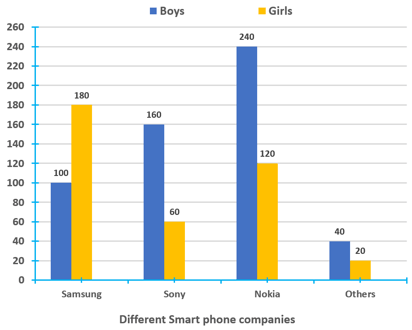
The bar chart representing the no. of students using different smart phones.
What percentage of girls are using the smartphones of Nokia?
Study the following graph carefully to answer the question.
The following Bar graph gives the number of products manufactured and sold by a company over the years (in thousands):
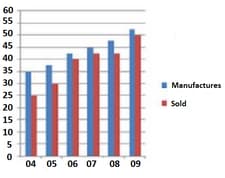
What is the respective ratio of the number of products not sold by the company in the year to those not sold in the year ?
Study the following graph which shows the income and expenditure of a company over the years and answer questions.
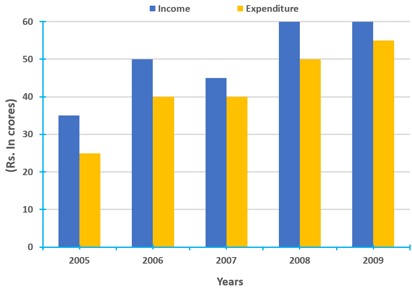
In how many years was the expenditure of the company more than the average expenditure of the given years?
The given bar-graph shows the percentage expenditure of a person on food and education items for five years and the table given below shows the total expenditure of that person for these five years.
| Year | Expenditure |
What is the difference between average money spent on food and education in the period of
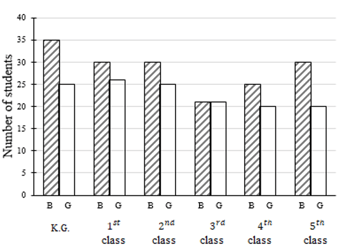
The following shows the roll of boys and girls in a school.
| Class | ||||||
| Boys | ||||||
| Girls |
The compound bar graph for the above data is
In a survey of families of a colony, the number of members in each family was recorded and the data has been represented by the following bar graph:
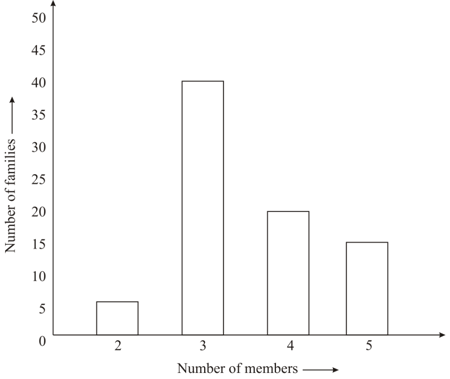
Read it carefully and answer the following question:
Which type of family is the most common?
Draw a double bar graph using the given information.
| Students in a school band | Classes | |
|---|---|---|
| Instrument | Class | Class |
| Piano | ||
| Guitar | ||
| Violin | ||
| Drums | ||
| Trumpet | ||
Which of the following is not a compound bar chart?
Which of the following is not a compound bar chart?
Read the following bar graph carefully and answer the question below:
Following bar graph represent the population of Male and Female in a city in year and .
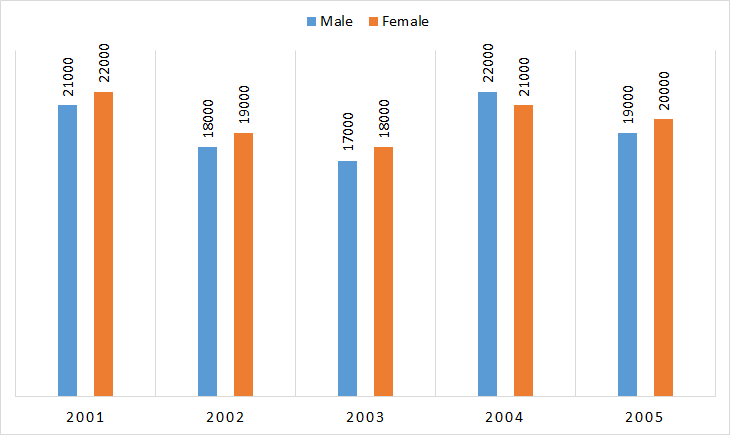
In the election , the of male population cast vote whereas of female population cast vote. In election of of male population cast vote whereas of female population cast vote. The only more than years person is eligible for voting. The male population are below years and of female population are below years. Find the difference between the number of voters who did not vote in the year and the number of voters who did not vote in the year .
Read the following bar graph carefully and answer the question below:
Following bar graph represent the population of Male and Female in a city in year and .
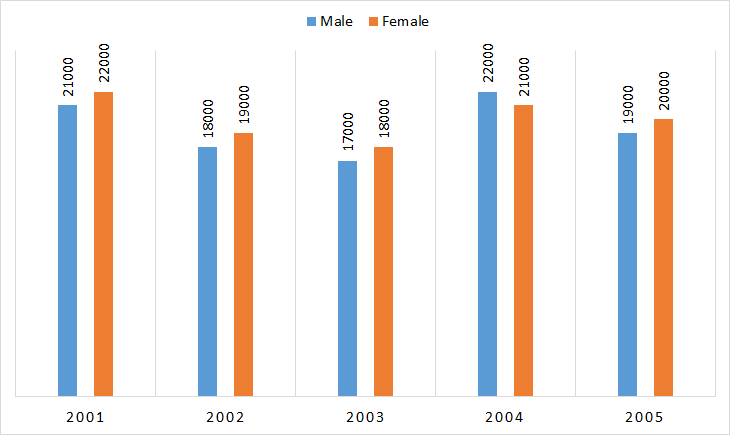
What is the difference between average male population in marathon and average female population in marathon?
Read the following bar graph carefully and answer the question below:
Following bar graph represent the population of Male and Female in a city in year and .
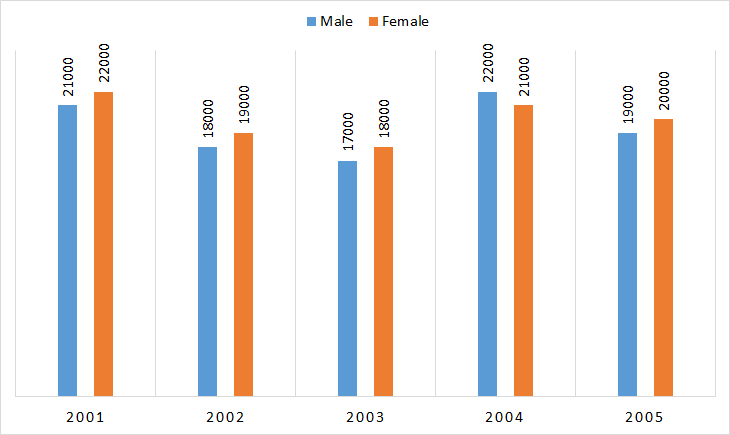
The of male population in year and is child and the of female population in and is child. The of male population in year and is child and the of female population in and is child. Find the difference between sum of child population of in year and sum of child population of .
Read the following bar graph carefully and answer the question below:
Following bar graph represent the population of Male and Female in a city in year and .
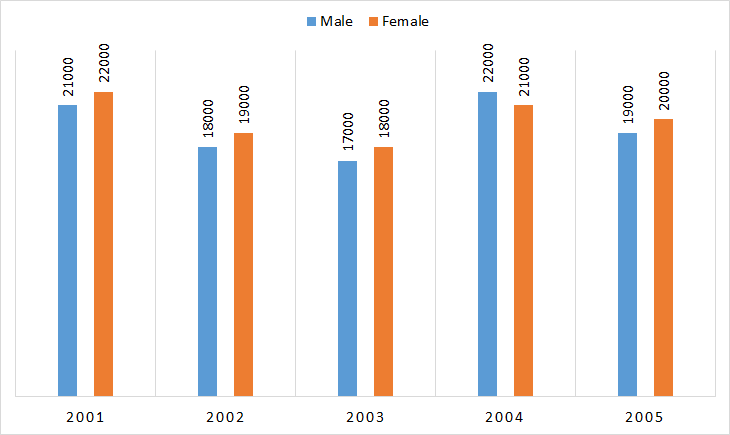
The total population is increased by in over the average population in and . The total population is increased by of in year The population of is what percent less or more than total population of year
Read the following bar graph carefully and answer the question below:
Following bar graph represent the population of Male and Female in a city in year and .
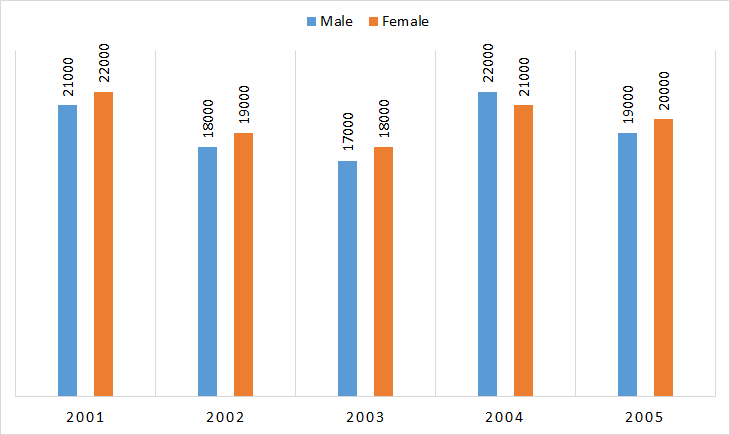
If the of male population is adult and of female population is adult then find the between average number of adult males population in and average number of adult female population in and .
Study the information and answer the question given below:
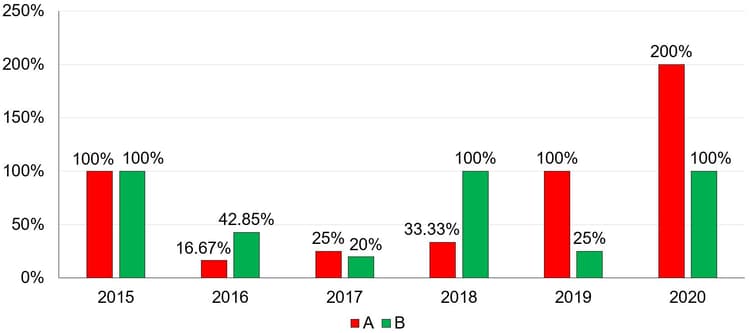
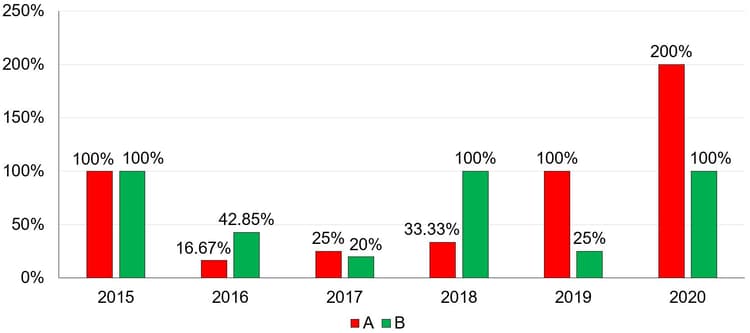
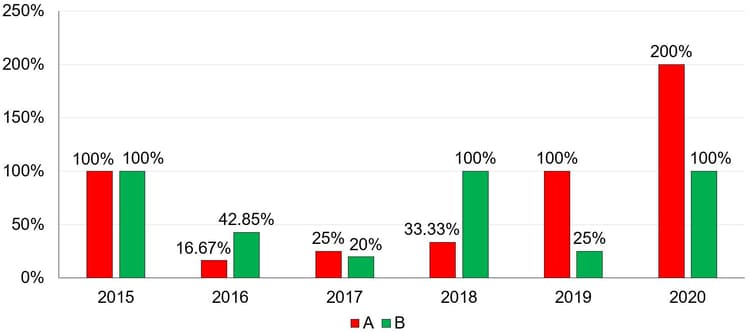
The below bar graph shows the information about profit percentage earned by the and over the years.
In the year , If the total income made by the company and the company is and the investment made by the company is more than the investment made by the company in the same year. Find the total investment made by the company and the company .
Study the information and answer the question given below:
The below bar graph shows the information about profit percentage earned by the and over the years.
If the income made by the company in is equal to the income made by the company in , then find the ratio of the investment made by the company in to that of the investment made by the company in .
Study the information and answer the question given below:
The below bar graph shows the information about profit percentage earned by the and over the years.
The amount invested by the company in is and the income of the company in is more than the income of the company in , the profit earned by the company in is what per cent more than the profit earned by the company in ?

