Correlation
Correlation: Overview
This Topic covers sub-topics such as Correlation, Positive Correlation, Negative Correlation, Uncorrelated and, Extrapolation of Data
Important Questions on Correlation
Define extrapolation and then determine the value of at on the straight line using a linear extrapolation method if the two given points that lie on the straight line is and .
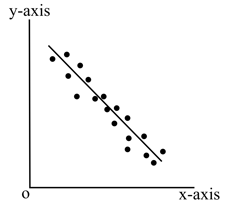
Explain Perfect Negative Correlation. Draw a scatter plot for Perfect Negative Correlation.
Determine the value of correlation coefficient for the scatter diagram given below.
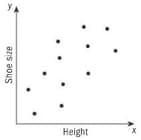
Identify the type of correlation between the weight and income of individuals.
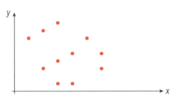
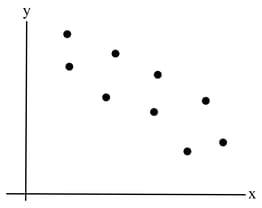
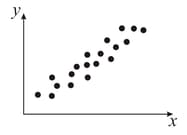
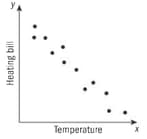
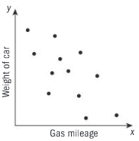
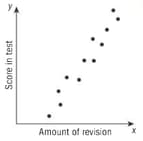
The type of correlation existing between the variables in the graph is
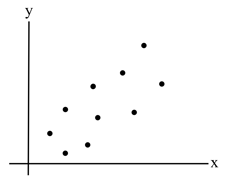
The type of correlation existing between the variables in the graph is
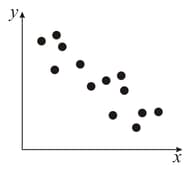
The type of correlation existing between the variables in the graph is
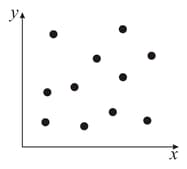
The type of correlation existing between the variables in the graph is
The height and weight of a group of persons will have
The widths and lengths of the leaves (both measured in centimeters) on a particular tree are recorded in the table below.
| Width (cm) | |||||||||||||||
| Length (cm) |
Draw a scatter diagram for this data with the length of the leaves shown on the vertical axis. Comment on the strength of correlation.
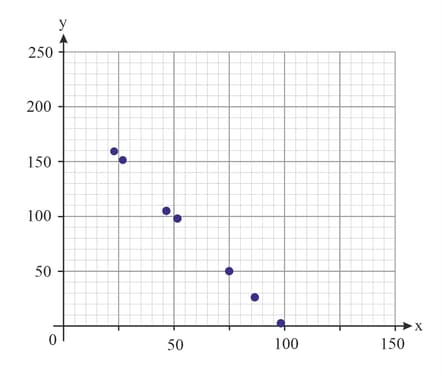
Determine the correlation by the given scatter diagram also, comment on the strength of correlation.
Determine the correlation shown by the given scatter diagram also, comment on the strength of correlation. 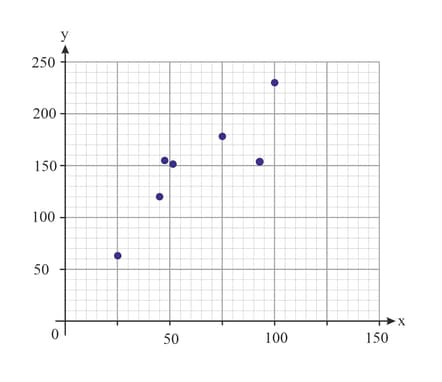
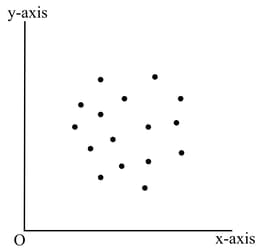
Describe the form, direction and strength of the association between the variables for the given scatter diagram.
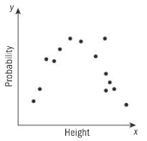
Describe the form, direction and strength of the association between the variables for the given scatter plot.
Describe the form, direction and strength of the association between the variables for the given scatter plot.
Describe the form, direction and strength of the association between the variables for the given scatter plot.
Describe the form, direction and strength of the association between the variables in the given scatter plot.