Frequency Table and Histogram of Classified Data
Frequency Table and Histogram of Classified Data: Overview
This topic explains concepts such as, Histogram of Grouped Data, Characteristics of a Histogram, Understanding an Histogram, Construction of Histograms, etc.
Important Questions on Frequency Table and Histogram of Classified Data
Draw the histogram for the following data.
| Class interval | |||||
| Frequency |
Draw Histogram of the given data.
| Weight | |||||
| No.of persons |
Draw a histogram for the data shown in the table.
| Number of students | ||||||
| Number of days |
Draw a histogram diagram for the data shown in the table.
| Diameter in | |||||
| Frequency |
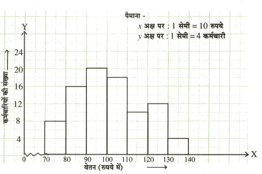
Identify the scale of below histogram
Identify the scale of below histogram
Identify the scale used in the histogram given below.
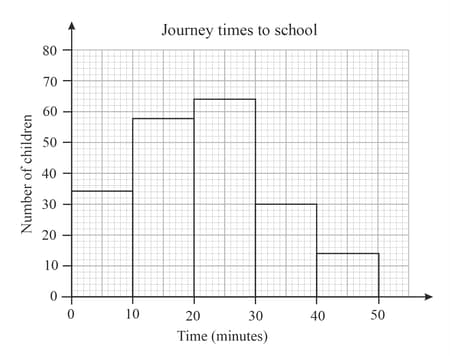
The table shows the times of children took to complete a long distance race. Draw a histogram of this.
Obtain the range of the data
The table below given the amount of water households are
See how this data is represented by a histogram. Also obtain the range of the data
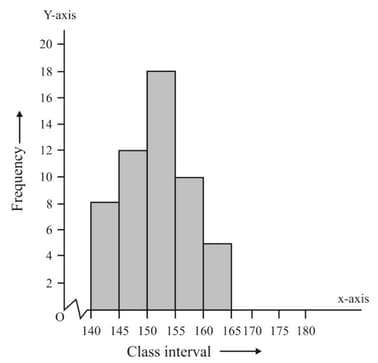
Answer the questions to see the histogram of the heights of students given below.
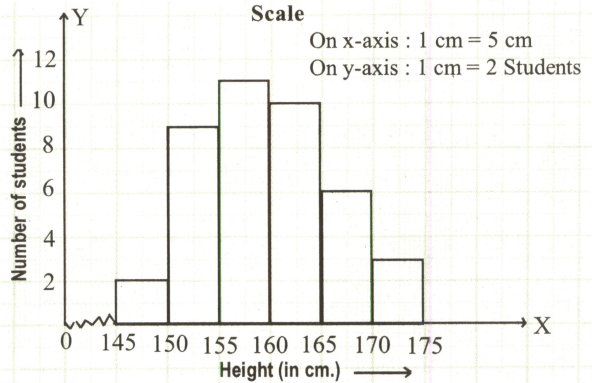
How many students are there with height or more?
Answer the questions to see the histogram of the heights of students given below.
How many students are there with a height less than ?
Answer the questions to see the histogram of the heights of students given below.
What is the number of students of the height
The weights of students of a class are
Prepare a frequency distribution table using one class interval as , in which is included and excluded. Which class interval has highest frequency.
The ages (in years) of patients treated in a hospital on a particular day are given below:
| Age (in years) | ||||||
| Number of patients |
Which age group has the highest number of patients.
Frequency curve is drawn from frequency polygon by smoothening the vertices.
The following table shows the number of illiterate persons in the age group ( years) in a town. How many illiterates are there in the age group .
| Age group (in years) | ||||||
| Number of illiterate persons |
In the histogram width of the bars need not be same whereas in the bar graphs widths are same.
Draw a histogram and hence estimate the mode for the following frequency distribution:
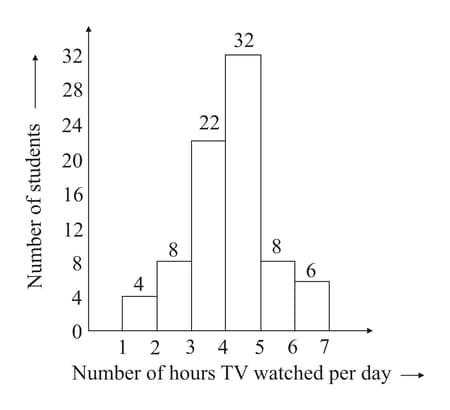
Following histogram shows the number of people owning the different number of books.
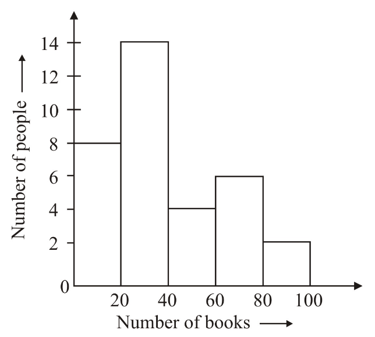
The number of people owning books more than is _____.
Histograms of the daily wages of the employees working in a factory are given. Answer the following questions on the basis of histograms.
How many employees are the highest paid per day?