
Bar Diagram
Bar Diagram: Overview
This Topic covers sub-topics such as Bar Diagram, Find Data Patterns with Bar Diagram, Conversion of Tabular Data in Bar Diagram, Bar Diagram with Simple Shapes and, Axes in a Simple Bar Diagram
Important Questions on Bar Diagram
Identify the pattern followed in the below bar graph.
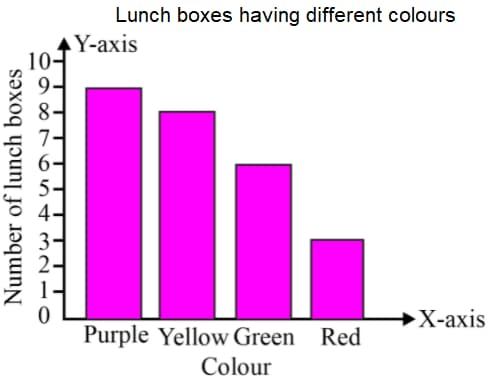
Identify the pattern followed in the below bar graph.
The following table shows the number of absent students.
| Classes | Absent students |
| Class | |
| Class | |
| Class | |
| Class | |
| Class |
Draw a horizontal bar diagram using simple shapes and identify the same number of absent students in which class is the least?
The following table shows the number of absent students.
| Classes | Absent students |
| Class | |
| Class | |
| Class | |
| Class | |
| Class |
Draw a horizontal bar diagram using simple shapes and identify the same number of absent students in which two classes?
The following table shows the number of students coming to the school by using a different way of communication.
| Way of Coming | bus | rickshaw | bicycle | tractor | on foot |
| Number of students |
Draw a bar diagram using simple shapes and identify the least number of students coming to school by which way of communication?
The following table shows the number of students coming to the school by using a different way of communication.
| Way of Coming | bus | rickshaw | bicycle | tractor | on foot |
| Number of students |
Draw a bar diagram using simple shapes and identify the most students coming to school by _____.
In a simple bar graph, the x-axis is called the vertical axis.
The number of axes in a simple bar graph is _____.
The following data gives information on the number of students involved in different activities.
| Activities | Music | Dance | Football | Cricket | Drawing |
| Number of Students |
The more students are involved in which activity?
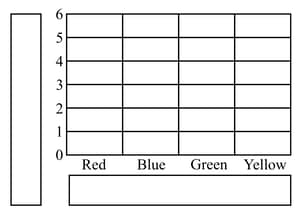
This bar graph shows how many pets class have.
Write on the -axis and on the -axis.
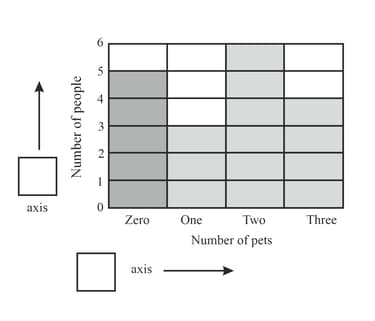
How many axis are there in simple Bar diagram
The following data gives the information of the number of children involved in different activities.
| Activities | Dance | Music | Art | Cricket | Football |
| No. of children. |
The percentage of total income spent under various heads by a family is given below.
| Different heads | Food | Clothing | Health | Education | House rent | Miscellaneous |
| % Age of total number |
Represent the above data in the form of bar graph.
_____ axis is the horizontal axis in a Bar diagram
How many pairs to flip flops did Mary receive for free?
How many pairs of flip flops did Mary purchase on her own?
The following graph shows different types of pens used by children in a hand writing class.
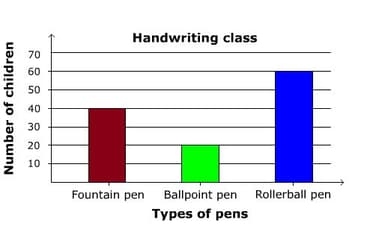
The teacher says that handwriting looks beautiful when we use a Fountain pen. The next day all the children who were using ballpoint pen started using a Fountain pen. But only half of the children who were using Rollerball pen, changed to a Fountain pen. What is the total number of children who use Fountain pens after the teacher’s advice?
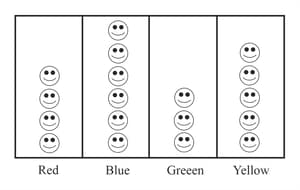
Raja has many pets in his house. Identify the correct graph which matches the statements given below
“ Raja has two cats less than dogs. He has three pigeons more than cats. “
A particular school had 4 sections in grade 8, each Section having 15 students.
In section A, 11 students participated in sports while the rest participated in arts
In section B, 5 students participated in arts while the rest participated in sports
In section C, 2 students participated in sports and 13 students participated in arts
In, section D 10 students participated in sports and 5 students participated in arts.
Identify the bar graph which represents the participation of students in all 4 sections of grade 8.


