
Data Interpretation Graphs
Data Interpretation Graphs: Overview
This topic covers concepts, such as, Organisation of Data, Graphical Representation of Data, Discrete Variables & Need for Capturing Data in Data Interpretation etc.
Important Questions on Data Interpretation Graphs
DIRECTIONS: Study the following table and answer the questions that follow:
| School | Number of students scoring marks less than | Number of students scoring marks greater than | The number of students who appeared |
| A | |||
| B | |||
| C | |||
| D | |||
| E |
Which of the following school has the highest number of students scoring exactly ?
Directions : In the following table the number of students passed in different subjects is given.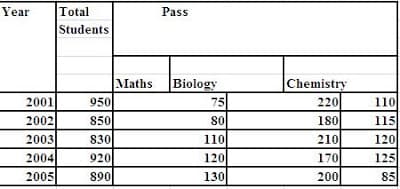
What is difference between total no. of students pass in biology and total no. of student pass in math?
Bar diagram which shows the production of electronic equipment from 2003 to 2007.
Production of Electronic Equipment (in )
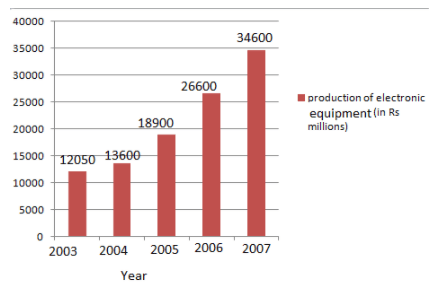
The average annual increase in the value of production (in ) for the given period is equal to _____.
The pie-chart represented below shows the spending by a family on various items during the year . Study the pie-chart carefully and answer the following question:

The ratio of the total amount of money spent on housing to the total amount of money spent on education was
The pie-chart represented below shows the spending by a family on various items during the year . Study the pie-chart carefully and answer the following question:

According to the pie-chart, the maximum amount was spent on which item?
The pie-chart represented below shows the spending by a family on various items during the year . Study the pie-chart carefully and answer the following question:
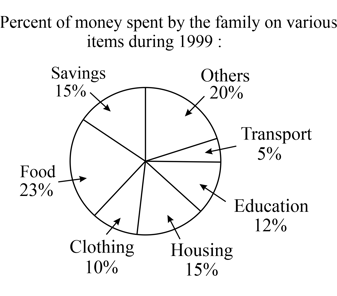
If the total expenditure of the family for the year was , then the savings (in rupees) of the family was
The pie-chart represented below shows the spending by a family on various items during the year . Study the pie-chart carefully and answer the following question:

If the total amount spent during the year was then how much money (in rupees) was spent on clothing and housing together?
The pie-chart represented below shows the spending by a family on various items during the year . Study the pie-chart carefully and answer the following question:

If the total amount spent during the year was , then the amount (in rupees) spent on food was
The following table represents the number of students enrolled in different streams in VIT Vellore.
| B. Tech | B. Pharma | B.Sc | B.A. | ||||
| Boys | Girls | Boys | Girls | Boys | Girls | Boys | Girls |
| 32 | 18 | 28 | 45 | 42 | 42 | 13 |
30 |
The ratio of the number of girls studying B.Sc and B.Tech to the total number of boys in all streams are:
The need for capturing data in data interpretation is used for _____ decision for any institution.
The need for capturing data in data interpretation can be used in service-based industry to _____ customer service.
The need for capturing data in data interpretation can be used in manufacturing plants to _____ the productivity.
The need for capturing data in data interpretation for business purposes is to significantly _____ the business efficiency.
Directions: Refer to the following pictorial graph:
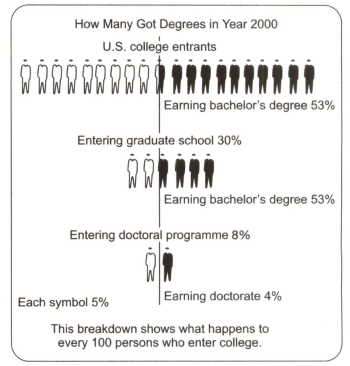
What per cent of people who enter a doctoral programme succeed in earning a doctorate?
Directions: Refer to the following chart:
Where Western Europe Gets Its Oil
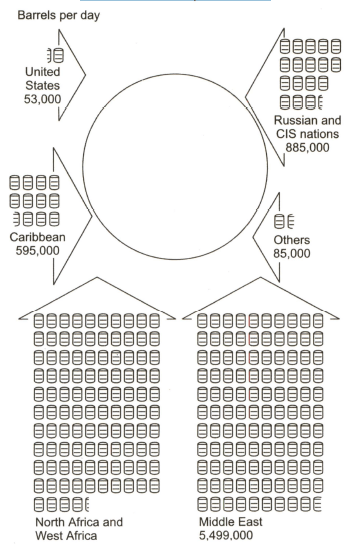
The Middle East supplies approximately what percentage of the total oil consumed in Western Europe?
The mean of items is and their SD is . The sum of all the items and the sum of the squares of the items is
The range ofthe set of observations is
The mean of the squares of first n natural numbers is
Geometric mean of the numbers is
Which graph-based data interpretation problem is useful for representing the continuous numerical data?


