
Pie Charts
Pie Charts: Overview
This Topic covers sub-topics such as Pie Chart, Advantages of Pie Charts, Limitations of Pie Charts, Structure of Pie Chart, Pie Charts with Data in Terms of Fraction and, Relation between Degrees and Percentage for Pie Charts
Important Questions on Pie Charts
Study the pie-chart carefully to answer the following questions.
Cost estimated by a family in renovation of their house.
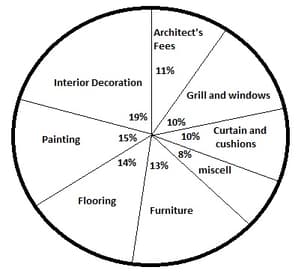
Total estimated cost is
Other than getting the discount of on the estimated cost of furniture and the actual miscellaneous expenditure being instead of the estimated one, the family's estimated cost is correct. What is the total amount spent by the family in renovating the house?
Read the following pie-chart carefully and answer the question given below.
The number of female candidates passed
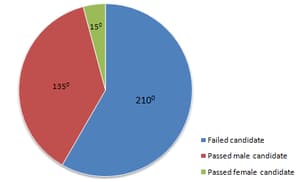
The percentage of passed female candidates with respect to total examinees is:
Read the following pie chart carefully and answer the question given below.
Number of cars of different models produced by a company in and :
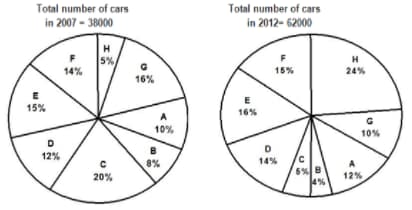
What is the approximate percentage increase in the number of cars of F model from to ?
Study the following information to answer the given questions.

Percentage of girls in different courses
Total students
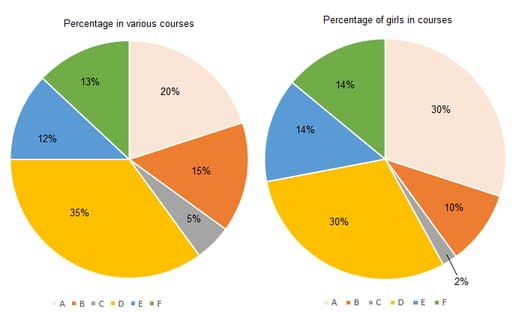
For which course is the number of boys the minimum?
Study the following pie-chart carefully to answer the question.
Total expenditure is .
The following pie-chart gives the expenditure of funds by the university for various purposes:
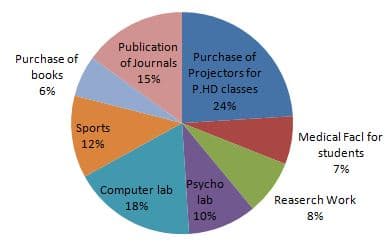
What is the difference between the expenditure made by the university for Publication of Journals and Psychology Laboratory?
Read the following pie chart carefully and answer the question given below.
Total number of passed students
Percentage of passed students in different colleges in an examination:
What is the average number of passed students in college B and C together?
Answer the below questions based upon the information given in the figure and table.
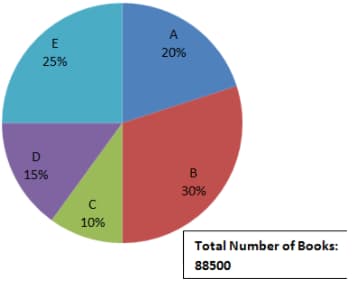
Total Number of Books
| Store | |
| A | |
| B | |
| C | |
| D | |
| E |
If each fiction costs and GK costs , what is the cost of each non-fiction book provided that total the total business of C is _____.
Following pie chart shows the % distribution of expenditure of two companies in different sectors. Total expenditure of company 'A' is crore and company 'B' is crore.
What is the ratio between money spent on tax by Company A and money spent on legal affair by Company B?
Read the following pie chart carefully and answer the question given below.
Total number of employees
Percentage distribution of employees of company X in different cities:
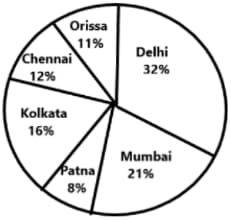
The number of employees in Orissa is what percent of the number of employees in Kolkata?
Study the following graph to answer the question given below.
Total students ( girls boys)
Percentage of students studying in various colleges and percentage of girls:
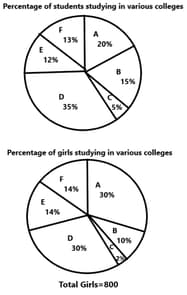
The number of girls is how much percent more than the boys studying in college E?
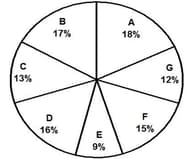
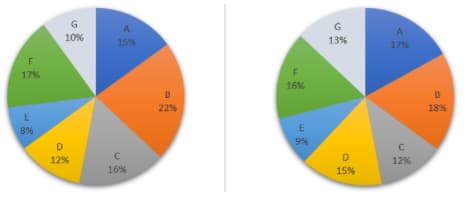
Directions : The following pie charts show the distribution of students of graduates and post-graduates levels in seven different institutes â A, B, C, D, E, F and G https://s3.ap-southeast-1.amazonaws.com/mockbank-staging-development/821eead8-769b-41c7-856b-14b19488f10b.png fetchpriority="high" alt="Question Image" decoding="async" loading="lazy" />
What is the ratio between the number of students studying at post-graduate and graduate levels respectively from institute F?
The following pie-chart shows the percentage distribution of total expenditure of Company A and Company B in the year . If the total expenditure of Company A is and that of Company B is , then answer the following question based on these pie-charts.
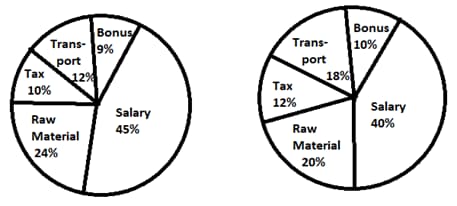
Money spent by Company B on Tax is how much percentage more than that of money spent by Company A for the Tax?
Study the pie-chart and line graph carefully to answer the given questions
The pie chart shows the percentage of train accidents in different years,
Total number of accident
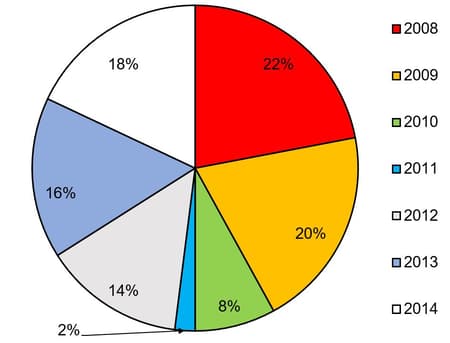
The line graph shows the number of persons who died in train accidents in various states in different years,
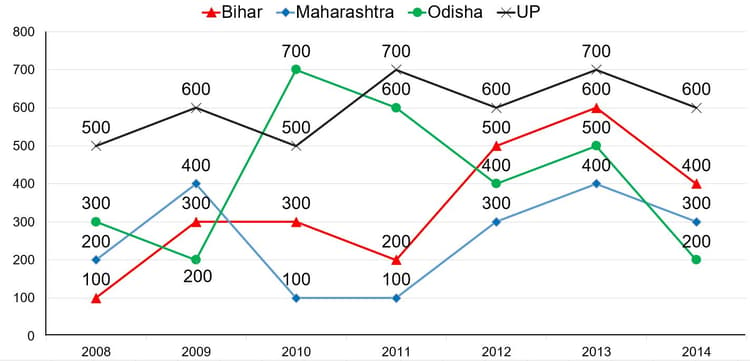

What is the average number of persons who died in train accidents in in all states together?
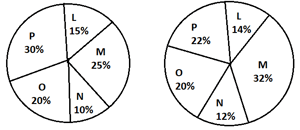
Percentages of different types of employees of two different companies A and B are given in the following pie-charts.
The numbers of IT executives in Company A and Company B are and respectively.
Answer the following question based on this information.

In which pair is the difference between the numbers of employees of these two types the same for Company A and Company B?
Read the following pie chart carefully and answer the question given below.
Degree-wise distribution of expenditure by a country on different sports in :
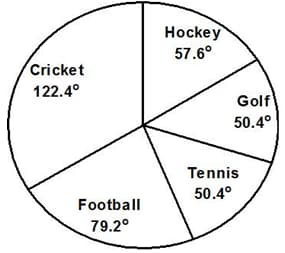
The expenditure on football was what percent of total expenditure?
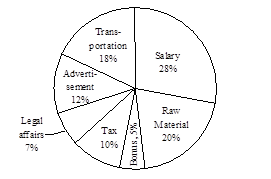
The following pie-chart shows the percentage distribution of the expenditure incurred in publishing a book. Study the pie-chart and answer the questions based on it.
VARIOUS EXPENDITURES (IN PERCENTAGE) INCURRED IN PUBLISHING A BOOK
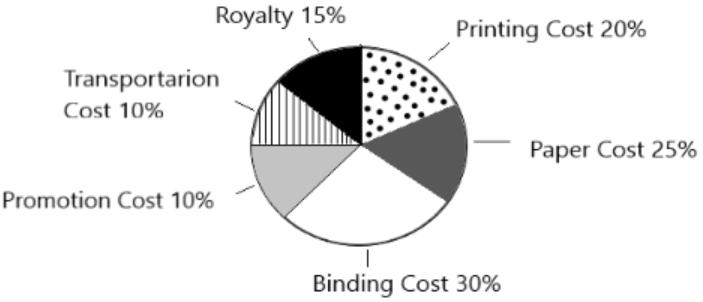
If copies are published and the transportation cost on them amounts to Rs then what should be the selling price of the book so that the publisher can earn a profit of
Read the following pie chart carefully and answer the question given below.
Total number of students
Number of students going to school
Percentage of students in five different villages and percentage of students going to school:
The number of students going to school from village L is approximately what percent of the number of students in the same village?
Read the following pie chart carefully and answer the question given below.
of the person liking different fruits in a village
Total number of the person
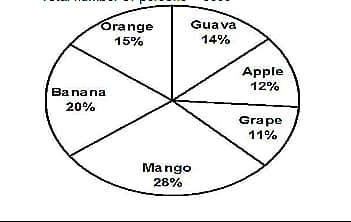
How many persons like orange?
Refer to the pie diagrams given below to answer these questions. The annual average receipts and outlays of the government in 2001-2002 are given in percentage .
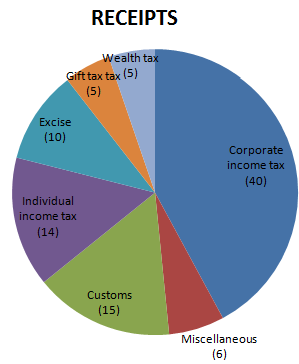
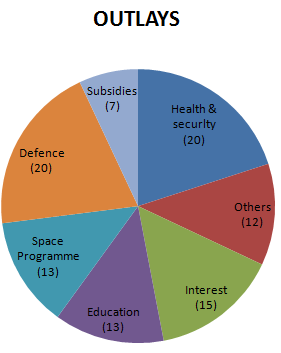
If the amount spent on subsidies is Rs 2403 crore, then the space programme outlay approximately.
Read the following Pie-chart carefully and answer the questions given below it.
Candidates Enrolled
Candidates who have successfully completed the course
Percentage-wise distribution of candidates enrolled for MBA and the candidates who have successfully completed the course from different institutes:
What is the percentage of successful candidates from institute E and F together over the candidates enrolled from these institutes together?


