
Pie Chart Representation of Data
Pie Chart Representation of Data: Overview
This Topic covers sub-topics such as Pie Chart, Advantages of Pie Charts, Limitations of Pie Charts, Structure of Pie Chart, Pie Charts with Data in Terms of Fraction and, Relation between Degrees and Percentage for Pie Charts
Important Questions on Pie Chart Representation of Data
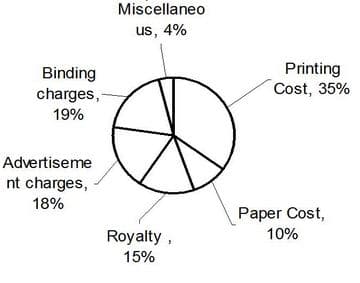
The pie chart given here shows various expenses of a publisher in the production and sale of a book. Study the chart and answer these questions based on it.
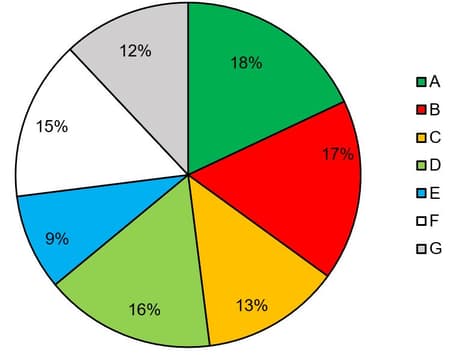
What is the number of candidates qualified from state E?
Study the pie-chart carefully to answer the following questions.
Cost estimated by a family in renovation of their house.
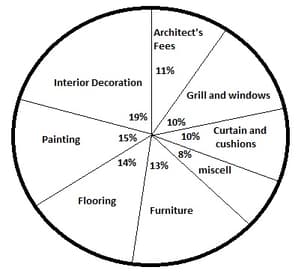
Total estimated cost is
Other than getting the discount of on the estimated cost of furniture and the actual miscellaneous expenditure being instead of the estimated one, the family's estimated cost is correct. What is the total amount spent by the family in renovating the house?
Read the following pie-chart carefully and answer the question given below.
The number of female candidates passed
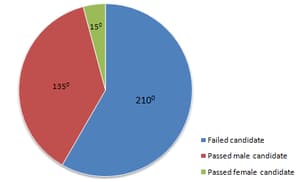
The percentage of passed female candidates with respect to total examinees is:
Study the following Pie-Chart carefully to answer these questions.
Total students
Percentage distribution of students in a different courses.
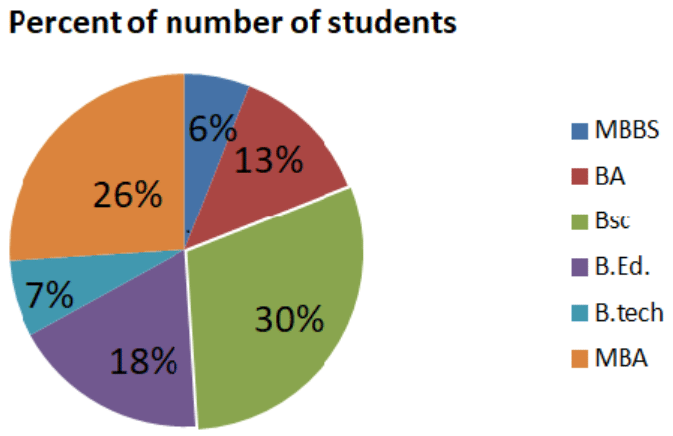
What is the total number of students B.Ed, B.A., and MBBS together?
Study the chart and answer the question below:
The following pie chart shows the collection of revenue of the Govt. of India in different departments.
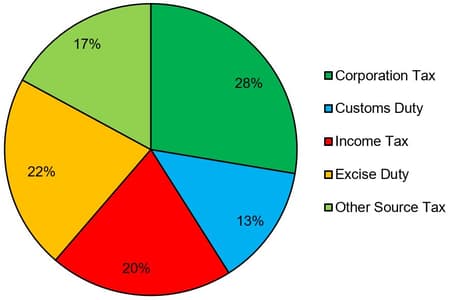
What is the total revenue from excise and corporation tax earned by Govt. of India, if the total revenue collected by Govt. of India is ?
Read the following pie chart carefully and answer the question given below.
Number of cars of different models produced by a company in and :
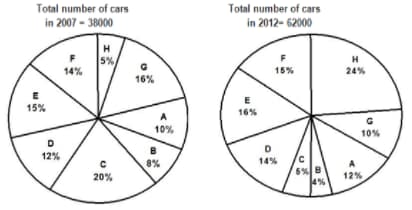
What is the approximate percentage increase in the number of cars of F model from to ?
Study the following information to answer the given questions.

Percentage of girls in different courses
Total students
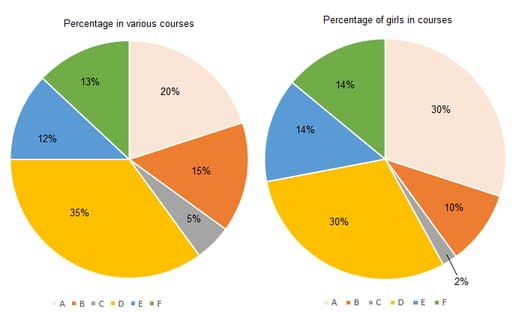
For which course is the number of boys the minimum?
Refer to the pie charts given below to answer the question.
MAJOR INPUTS USED IN AGRICULTURE
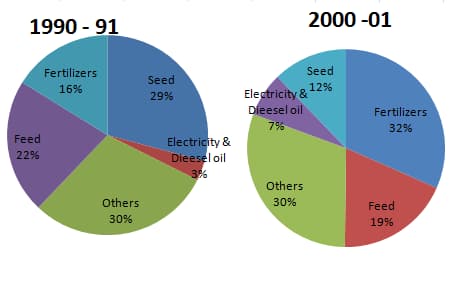
Total ₹ Total ₹
The input of the feed in the from that in the has approximately
Directions: Study the Pie-charts below to answer the following question.
The below pie-charts shows the distribution of candidates who joined M.B.A. programme and successfully completed it.
The below pie chart shows the number of candidates who join MBA,

The number of candidates who join MBA
The below pie chart shows the number of candidates who completed MBA,
The number of candidates who completed MBA
The number of candidates who completed the M.B.A. programme from A and D Institutes together exceeds the number of candidates who joined Institutes C and E together by-
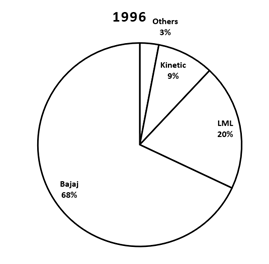
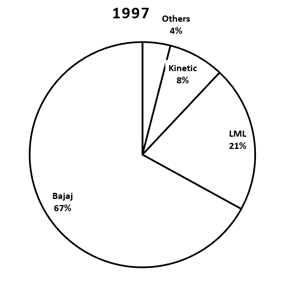
The above pie charts given the sales of scooters by different companies for
Scooter sales in
Scooter sales in
Sales in
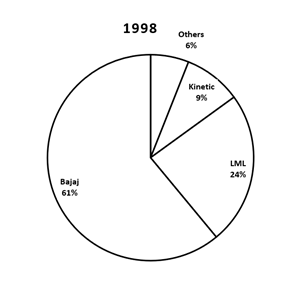
Assuming the scooter market grows by for the next two years and the market share of LML, kinetics and others remain the constant, then the market share of Bajaj in shall be ________.
Study the following pie-chart carefully to answer the question.
Total expenditure is .
The following pie-chart gives the expenditure of funds by the university for various purposes:
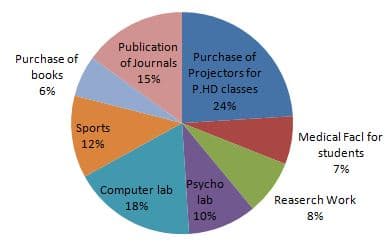
What is the difference between the expenditure made by the university for Publication of Journals and Psychology Laboratory?
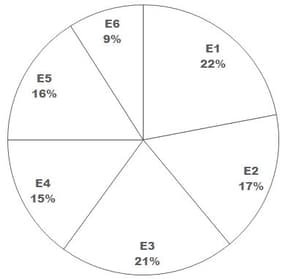
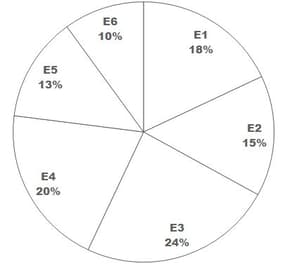
Directions : In the following pie-charts the percentage of different categories of employees of two companies are given and the table shows the percentage of Male employees among them. The total employees in Company is and that in Company is
Company
Company
The table is given below:
| Male in | Male in | |
What is the average number of male employees of all categories in Company
These questions are based on the following pie charts.
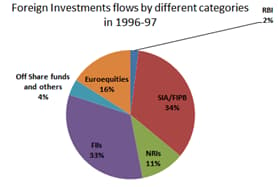
Total investment flows
In the FII sector, how many degrees approximately should be in the central angle?
Read the following pie chart carefully and answer the question given below.
Total number of passed students
Percentage of passed students in different colleges in an examination:
What is the average number of passed students in college B and C together?
Following pie chart shows the % distribution of expenditure of two companies in different sectors. Total expenditure of company 'A' is crore and company 'B' is crore.
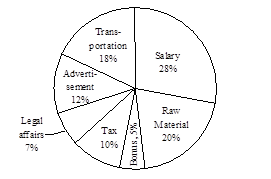
What is the ratio between money spent on tax by Company A and money spent on legal affair by Company B?
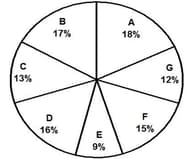
Directions: Study the pie chart and answer the questions given below.
Air conditioner manufacturing company manufacturing models of air conditioners - . In the year the company generates a revenue of by selling air conditioners.
The manufacturing cost of each AC is .

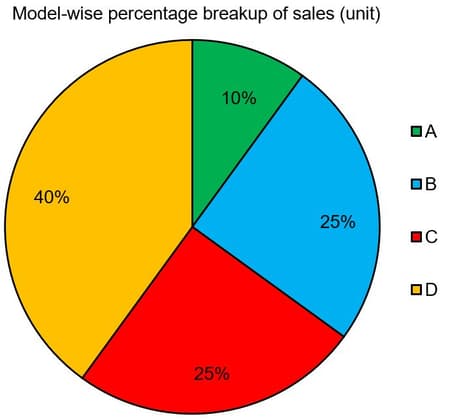
Percentage profit is maximum for which models?
Read the following pie chart carefully and answer the question given below.
Total number of employees
Percentage distribution of employees of company X in different cities:
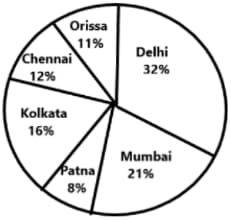
The number of employees in Orissa is what percent of the number of employees in Kolkata?
Study the following pie chart carefully to answer these questions.
The following pie chart gives the expenditure of funds by the university for various purposes.
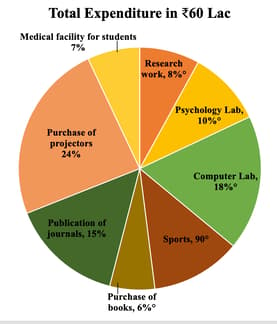
What is the respective ratio between the expenditure made by the university on research work and the purchase of books for the library?
Distribution of candidates who were enrolled for MBA entrance exam and the candidates (out of those enrolled) who passed the exam in different institutes: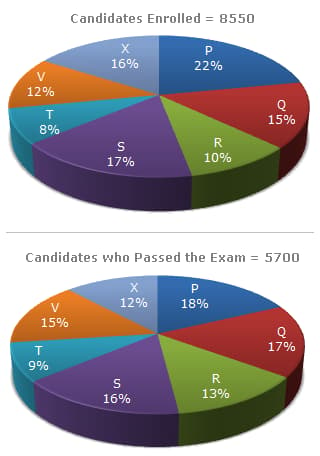
What percentage of candidates passed the Exam from institute T out of the total number of candidates enrolled from the same institute?
Study the following graph to answer the question given below.
Total students ( girls boys)
Percentage of students studying in various colleges and percentage of girls:
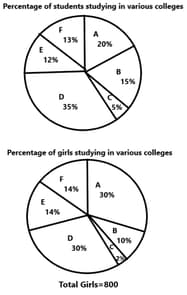
The number of girls is how much percent more than the boys studying in college E?


