Ellingham Diagrams
Ellingham Diagrams: Overview
This topic covers concepts, such as Ellingham Diagram, Limitations of Ellingham Diagram, and Applications of Ellingham Diagram.
Important Questions on Ellingham Diagrams
Which of the following statements about the Ellingham Diagram (ED) is FALSE?
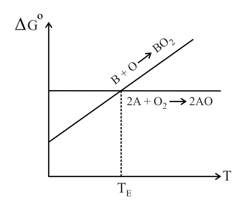
The Ellingham diagram is given for the gaseous oxides and . (Assume A and B are solid metals)
Which of the following are false about the Ellingham diagram?
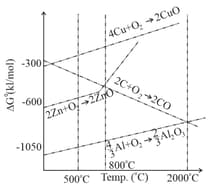
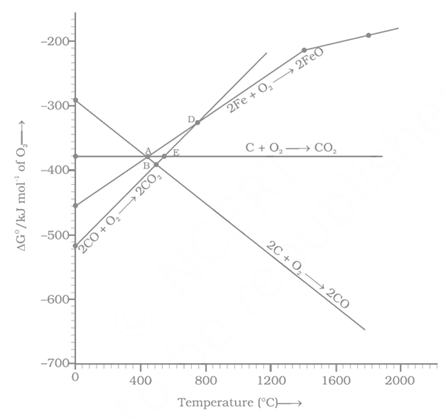
The plot of versus temperature for the formation of oxides of elements is called
Which of the following statement is incorrect?
In Ellingham diagrams of oxide formation which of the following graphs has negative slope?

Which of the following statement is correct w.r.t. the following graph?
Ellingham diagrams are plots of for the formation of:
Below point can _____.
Which of the following metals cannot be obtained by reduction of its metal oxide by aluminium?
Ellingham diagram represents change of
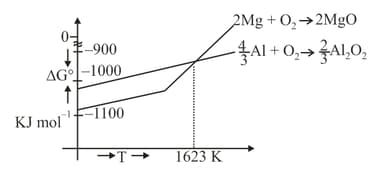
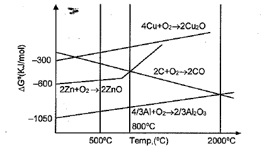
Considering Ellingham diagram, which of the following metals can be used to reduce alumina?
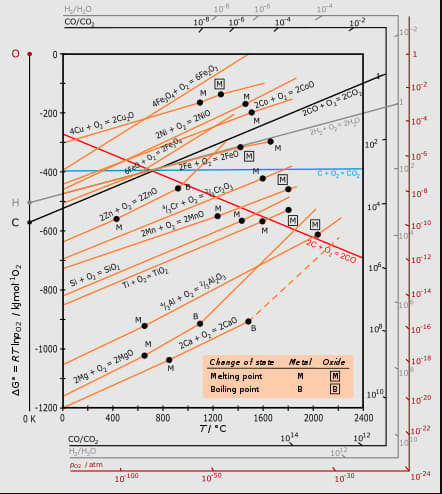
Which of the following are incorrect on basis of above ellingham diagram for carbon?
The correct statement regarding the given Ellingham diagram is:
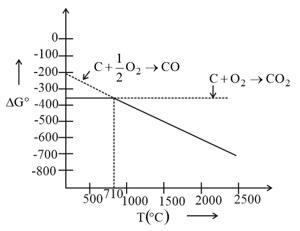
Below the temperature of carbon cannot reduce to because:
For which of the following oxide, carbon reduction is not used for its commercial extraction?
The above reaction is spontaneous at :
Which of the following factors is not relevant for roasting sulphide ores to oxides and not subjecting the sulphide ores to carbon reduction directly?
Carbon reduction can not be used for extraction of which of the following metals?
Select the incorrect statement about Ellingham diagram:
The correct statement regarding the given Ellingham diagram