
Dual and Compound Bar Charts
Dual and Compound Bar Charts: Overview
This Topic covers sub-topics such as Bar Graph, Understanding a Bar Graph, A Double Bar Graph of Data, Understanding Compound Bar Graph and, Drawing a Double Bar Graph
Important Questions on Dual and Compound Bar Charts
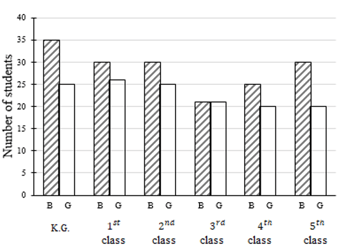
The following shows the roll of boys and girls in a school.
| Class | ||||||
| Boys | ||||||
| Girls |
The compound bar graph for the above data is
In a survey of families of a colony, the number of members in each family was recorded and the data has been represented by the following bar graph:
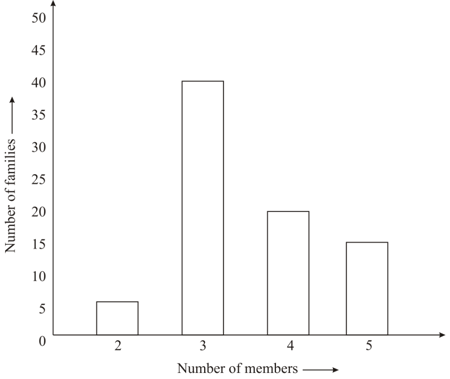
Read it carefully and answer the following question:
Which type of family is the most common?
Draw a double bar graph using the given information.
| Students in a school band | Classes | |
|---|---|---|
| Instrument | Class | Class |
| Piano | ||
| Guitar | ||
| Violin | ||
| Drums | ||
| Trumpet | ||
The histogram given depicts the marks obtained by students of class in English. Look at the histogram and answer the following questions.
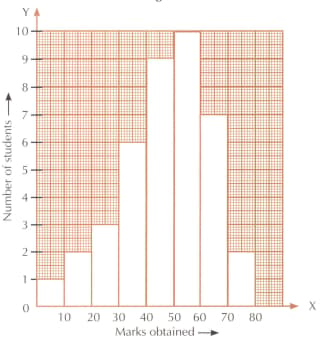
What is the class size?
Observe the given graph carefully and fill in the blank.
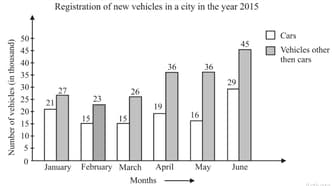
The month in which the registration of vehicles other than cars is maximum, is _____.
Observe the given graph carefully and fill in the blank.

The difference between the number of cars registered in January to those registered in June, is _____.
Observe the given graph carefully and fill in the blank.
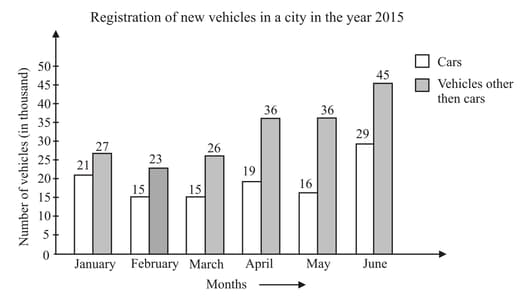
The increment in the number of vehicles other than cars from January to April, is _____.
The following bar graph shows the number of hours of sunshine on each of the days of a week.
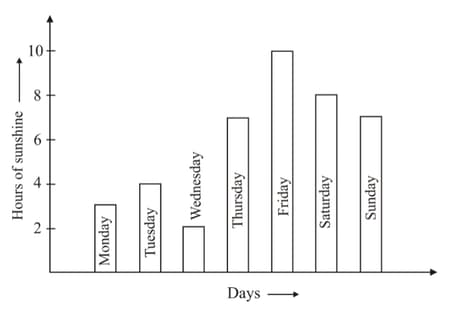
Observe the above bar graph during the entire week, the total number of hours of sunshine on various days, is _____.
The following bar graph shows the number of hours of sunshine on each of the days of a week.
The sunshine was for the minimum number of hours on _____.
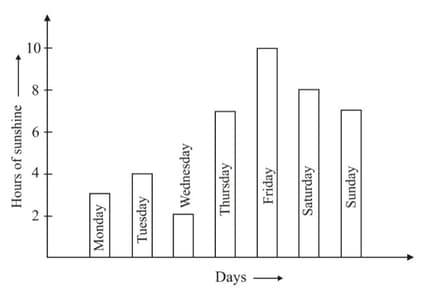
The following bar graph shows the number of hours of sunshine on each of the days of a week.
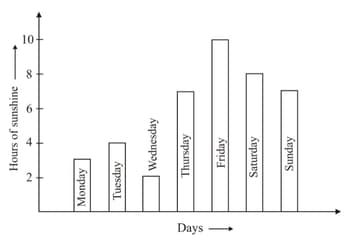
Observe the above bar graph and fill in the blank.
On _____, the sunshine was for the maximum number of hours.


