
Basic Graphical Representations
Basic Graphical Representations: Overview
This topic discusses various tools to represent data like bar graph, pie graph, histogram and line graph with the help of diagrams for each. We will also learn to interpret them here.
Important Questions on Basic Graphical Representations
Study the following graph carefully and answer the given question. Number of students (Males & Females) passed out from various colleges in a year. (Number in thousands) is shown below:
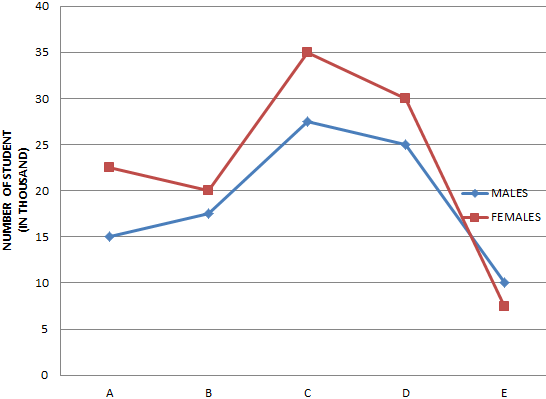
COLLEGES
What is the average number of students (Males & Females) passed out from all the colleges together?
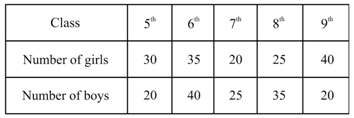
Construct a double bar graph, using the table given below:
Suppose population of India and China are
Construct a double bar graph, using the table given below:
Construct a double bar graph, using the table given below:
Kiara measured the weight of her dog at the end of every month. She used a line graph to display the data.
Between which two months did the dog grow the most?
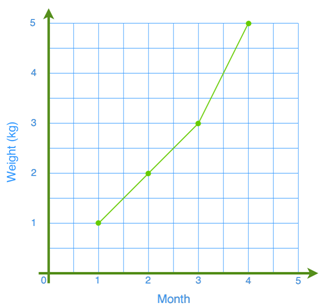
Jane measured the weight of her kitten at the end of every month. She used a pictograph and a line graph to display the data.
| Month | 1 | 2 | 3 | 4 |
| Weight (kg) | 1 | 2 | 3 | 5 |
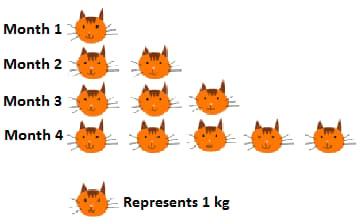

In which two months did the kitten grow at the same rate? Which graph shows this more clearly?
The line graph is given below shows the sales of a shopkeeper in the first week of January .
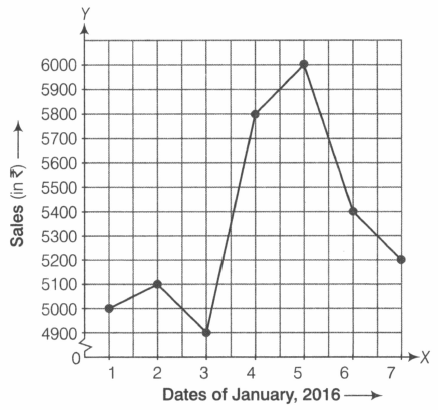
If the cost of one doll is , then how many dolls were sold on January by the shopkeeper.
The following table gives the quantity of petrol and its cost.
| Quantity of petrol (in litres) | 10 | 15 | 20 | 25 |
| Cost of petrol (in ₹) | 500 | 750 | 1000 | 1250 |
The graph given below is showing the above data.
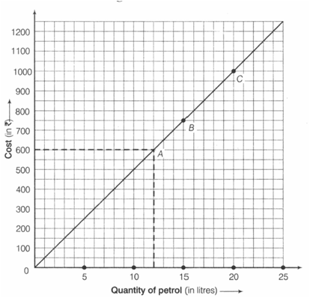
At the cost of , how much petrol do you get?
A courier-person cycles from a town to a neighbouring suburban area to deliver a parcel to a merchant. His distance from the town at different times is shown by the following graph.
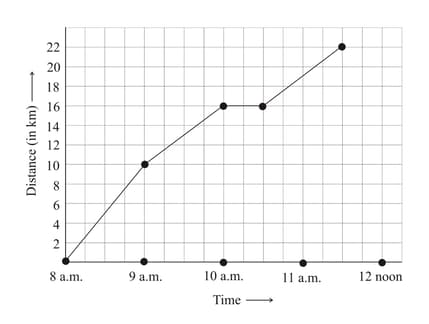
If the distance of the place of merchant from the town is , write as the final answer.
The line graph in the figure below shows the academic performance of two students during a year. Read the graph and find the following.
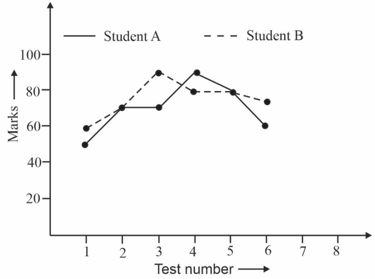
What is the difference between the least marks scored by student and student ? Write the numerical value of marks as the final answer.
The figure is a bar graph showing the number of students in different clubs of the school:
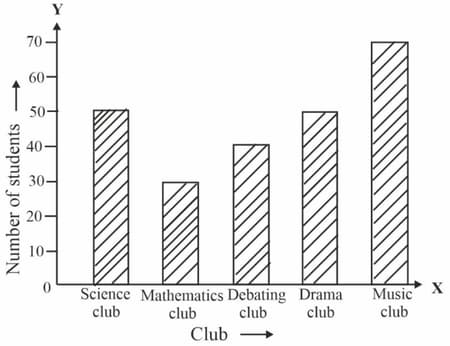
_____ club is most popular among the students?
The temperatures () of a city for the month of November, are given below.
What is the maximum temperature in November?
The temperatures () of a city for the month of November, are given below.
What is the minimum temperature in November?
The frequency distribution of heights(in ) of students of a locality is given below.
| Height (in ) | |||||
| Frequency |
What is the upper limit of the third class interval?
The fourth and fifth grade student voted for the type of playground equipment they would like to have. Draw a double bar graph for the data
| Equipment | Fourth Grade | Fifth Grade |
| Monkey bars | ||
| Basketball hoop | ||
| Soccer net |
In Horizontal bar graphs, the data categories are represented on _____ axis.
The following table shows the number of visitors to a park for the months January to March.
| Month | January | February | March |
| Number of visitors |
Construct a horizontal bar chart for the table.
Data can be represented only in line and bar graphs.
The given table represents the runs scored by Vishal in his interschool cricket premier league.
35 | 23 | 80 | 76 | 111 |
57 | 43 | 15 | 63 | 82 |
0 | 12 | 101 | 2 | 11 |
67 | 125 | 58 | 14 | 97 |
53 | 73 | 89 | 42 | 8 |
Identify the correct histogram which represents the given table.
The bar graph below shows the number of defects reported by the quality assurance (QA) team of a company against its product. The graph represents the defect status of the product for successive months, starting from the month of June.
The QA team initiate defect cases as they test the product and close them after making sure that the defect is removed successfully.
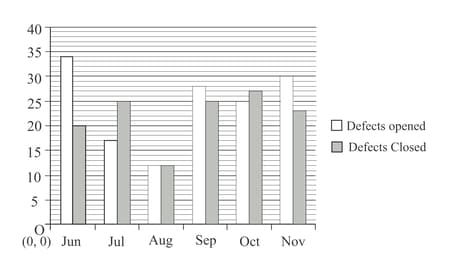
The total number of defects that were not resolved till the last day of November is _____.


