
Data Interpretation Graphs
Data Interpretation Graphs: Overview
This Topic covers sub-topics such as Data Interpretation, Graphical Representation of Data, Continuous Variables, Discrete Variables, Organisation of Data, Types of Data Interpretation, Variables in Data Interpretation and, Importance of Unit in Data
Important Questions on Data Interpretation Graphs
DIRECTIONS: Study the following table and answer the questions that follow:
| School | Number of students scoring marks less than | Number of students scoring marks greater than | The number of students who appeared |
| A | |||
| B | |||
| C | |||
| D | |||
| E |
Which of the following school has the highest number of students scoring exactly ?
Directions : In the following table the number of students passed in different subjects is given.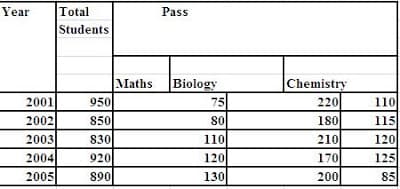
What is difference between total no. of students pass in biology and total no. of student pass in math?
Bar diagram which shows the production of electronic equipment from 2003 to 2007.
Production of Electronic Equipment (in )
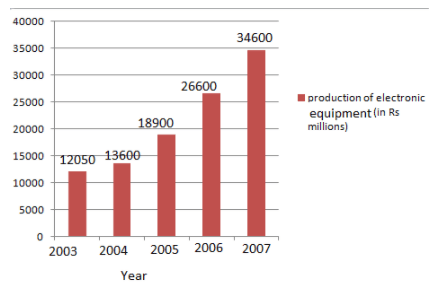
The average annual increase in the value of production (in ) for the given period is equal to _____.
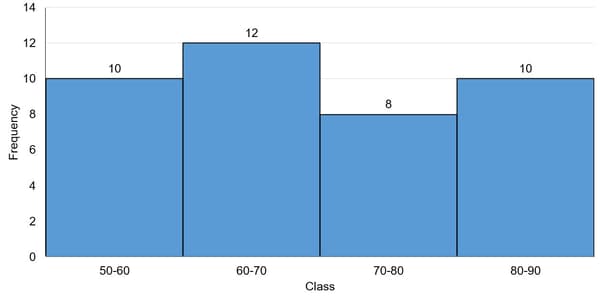
The following table shows the number of marks secured by the students of a class in a marks exam.
How many students secured less than or equal to marks in that exam?
| Score | Number of Students |
| Less than or equal to marks | |
| More than marks and less than or equal to marks | |
| More than marks and less than or equal to marks | |
| More than marks and less than or equal to marks | |
| More than marks and less than or equal to marks |
The following table represents the number of students enrolled in different streams in VIT Vellore.
| B. Tech | B. Pharma | B.Sc | B.A. | ||||
| Boys | Girls | Boys | Girls | Boys | Girls | Boys | Girls |
| 32 | 18 | 28 | 45 | 42 | 42 | 13 |
30 |
The ratio of the number of girls studying B.Sc and B.Tech to the total number of boys in all streams are:
The need for capturing data in data interpretation is used for _____ decision for any institution.
The need for capturing data in data interpretation can be used in service-based industry to _____ customer service.
The need for capturing data in data interpretation can be used in manufacturing plants to _____ the productivity.
The need for capturing data in data interpretation for business purposes is to significantly _____ the business efficiency.
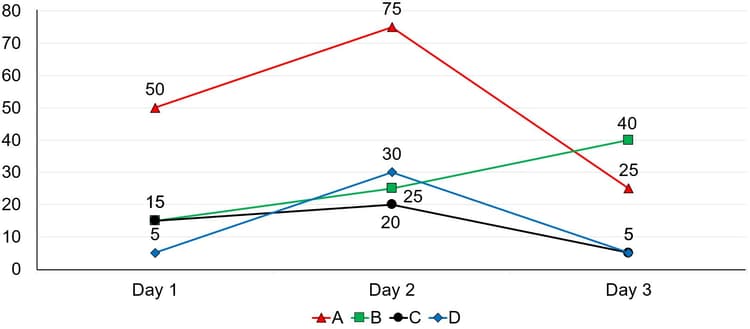
Study the following information and answer the question given below:
The below line graph shows the time of travel (in ) for different persons on various days.
The below table shows the information regarding the distance travelled by different people on various days.
| Person | Day | Day | Day |
Find the ratio of the average speed of to the person .
Which graph-based data interpretation problem is useful for representing the continuous numerical data?
Which one of the following statements is correct regarding the quantitative type data interpretation?
Which one of the following statements is correct regarding the qualitative type data interpretation?
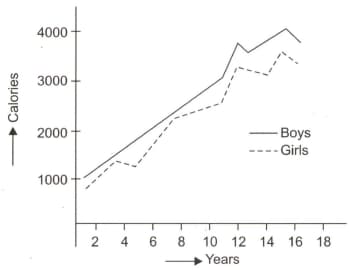
Which one of the following statements is correct regarding the graph shown below for the data interpretation problem?
If there is a direct relationship between growth and calorie intake, the graph indicates the most girls will have completed their physical growth about.
Methods of representation of data are
Which of the following cannot be concluded from the given graph?
Scientists use number when:
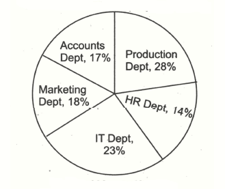
Study the following pie chart and table carefully to answer the question that follows.
Percentage breakup of employees working in various departments of an organization and the ratio of men to women in them:
Percentage breakup of employees:
Total number of employees
Ratio of men to women:
| Department | Men : Women |
| Production | : |
| HR | : |
| IT | : |
| Marketing | : |
| Accounts | : |
What is the respective ratio of the number of men working in the Accounts department to the total number of employees working in that department?


