Graphical Representation of Motion
Graphical Representation of Motion: Overview
This topic covers concepts, such as, Slope of Distance-time Graphs, Slope of Velocity-time Graphs,Distance-time Graphs and Velocity-time Graphs etc.
Important Questions on Graphical Representation of Motion
The position-time graphs for two students and returning from the school to their homes are shown in figure.
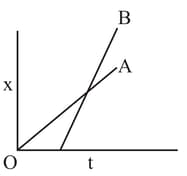
(A) lives closer to the school
(B) lives closer to the school
(C) takes lesser time to reach home
(D) travels faster than
(E) travels faster than
Choose the correct answer from the options given below
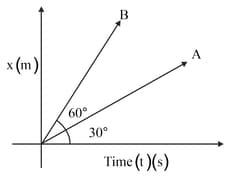
The ratio of velocity of two objects and is . If the position-time graph of object is inclined to time axis
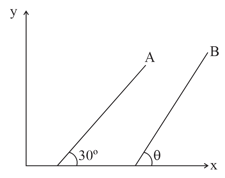
Which one of the following represents the displacement-time graph of two objects A and B moving with zero relative speed :-
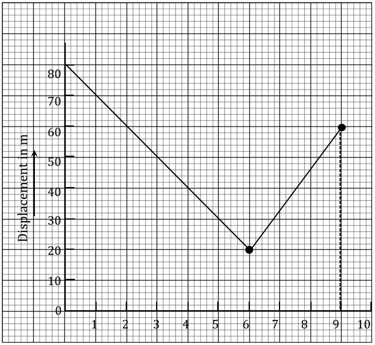
The displacement time graph of a particle moving along a straight path is as shown in the figure. What is the average velocity of the particle?
Distance () travelled by a particle has been plotted with time
Is it possible that the particle has zero displacement in the first of its motion?
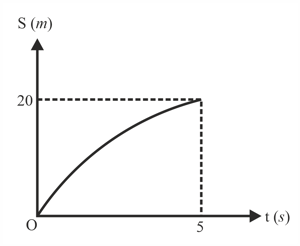
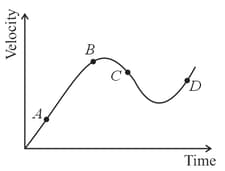
The velocity-time graph of a particle moving in a straight line is shown in the figure. The instantaneous acceleration of the particle is negative at the point
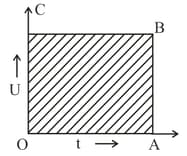
What does area of OABC in the following graph represent?
What is a distance time graph?
A particle starts from rest moves in with uniform acceleration for , then it applies brakes, retards uniformly and stops in next . Draw its vs graph, vs graph and vs graph.
Figure shows position vs time graph for a particle moving along axis. Consider the motion during two time durations :from time to time and from time to time . Speed of the particle is increasing:
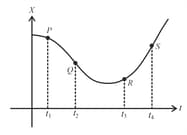
Following graph shows position vs time graph of a particle in motion. Find the average velocity between times to . Find the instantaneous velocities at times .
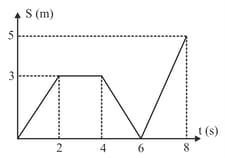
Speed time graph of a particle moving along a fixed direction is as shown in figure. The average speed of the particle between to is
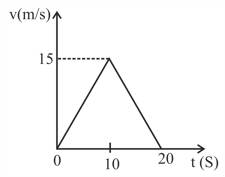
The figure shows the velocity (v) of a particle moving on a straight line plotted against time (t).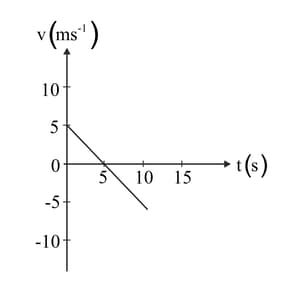
The position-time graph of two objects A and B is shown in the figure. What is the ratio of the velocities of object A with the velocity of object B?
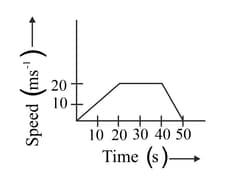
The graph in figure shows the movement of a car over a period of 50 s. What distance was travelled by the car while its speed was decreasing?
Is it compulsory to start displacement time graph from origin? (Yes, No)
Which graph gives the velocity as its slope?
For the following velocity - time graph, the average speed for the motion during the first is
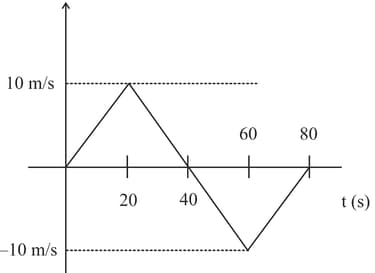
Will a body possess both distance-time graph and displacement time graph? If so, also explain about its velocity-time graph and speed-time graph.
In distance-time graph, why is the speed always positive even if the gradient is negative?

